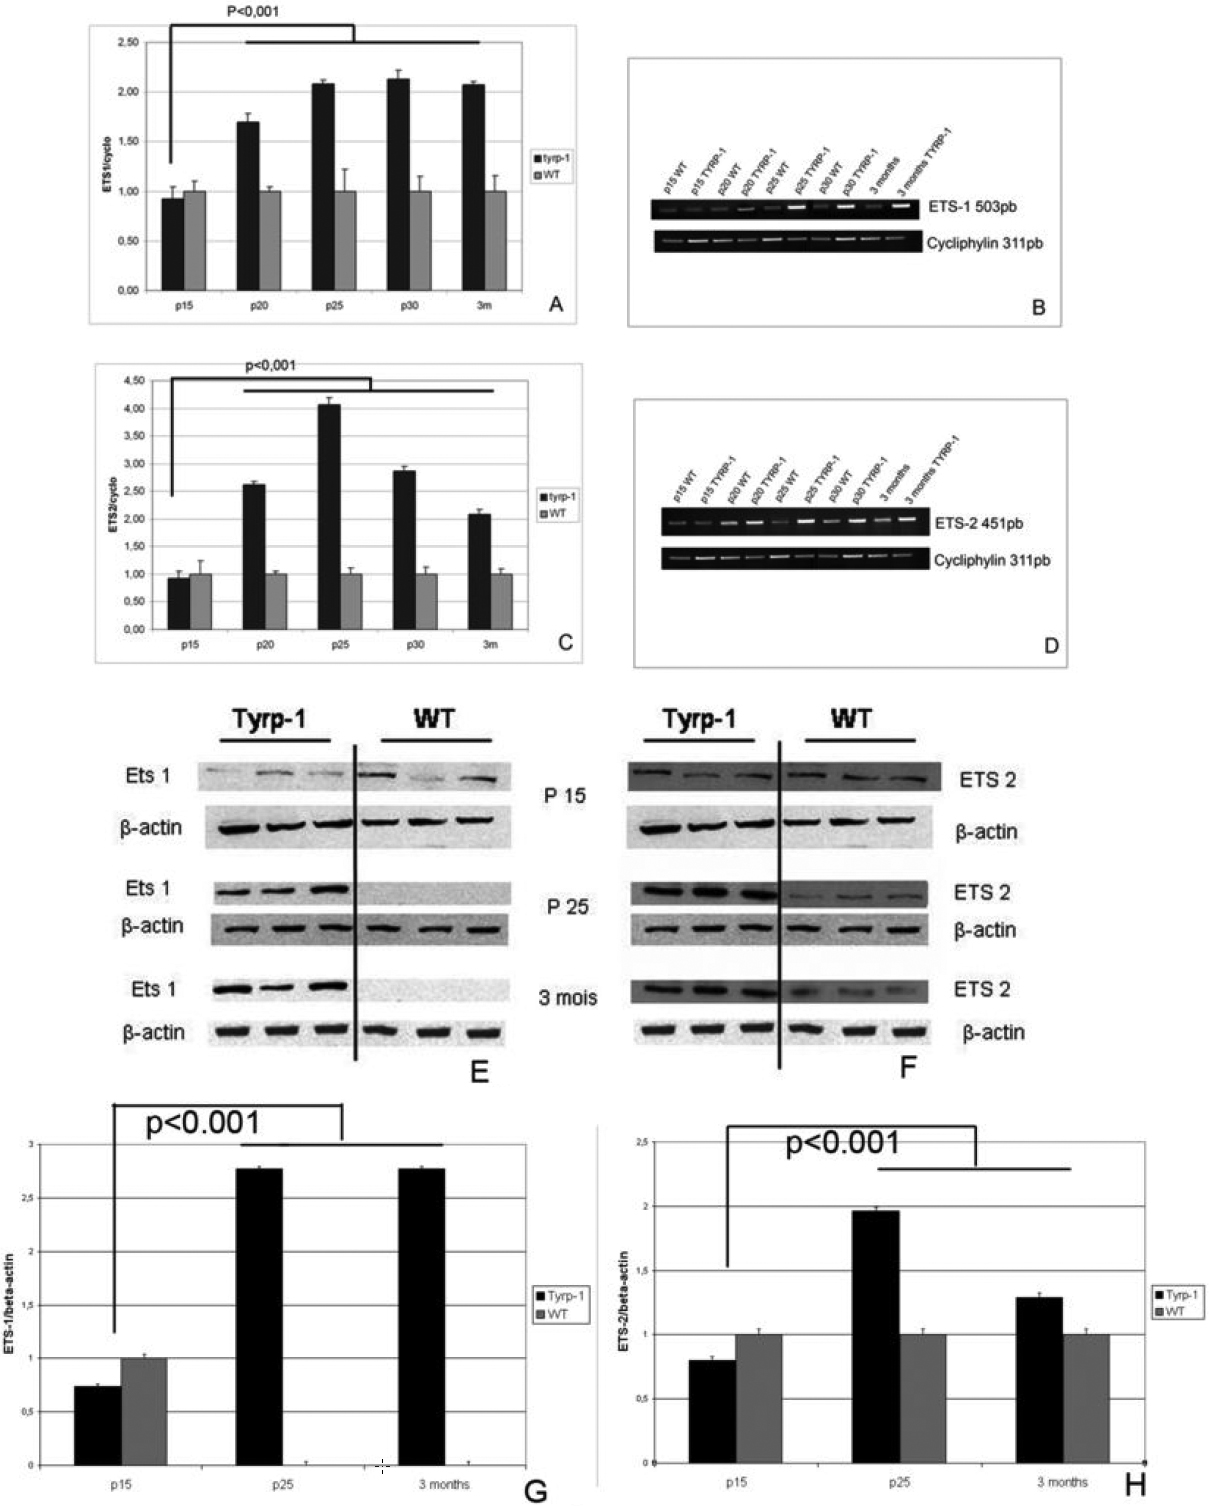
Figure 3. Overproduction of ETS-1
and ETS-2 mRNAs and proteins in a mouse model of ocular
neoplasm
(Tyrp-1), with respect to control mice (WT) between P15 and three
months. mRNA levels were determined by semi-quantitative RT–PCR. The
values shown correspond to the levels of overproduction of ETS-1 and
ETS-2 with respect to levels in normal control mice at the same age.
The graphs (A and C) show the intensity level of each
PCR band, corresponding to ETS-1 (A) and ETS-2 (C) as
measured by densitometric analysis. The cyclophilin is used as an
internal standard control. The PCR bands for ETS-1 (B) and ETS-2
(D) are shown. The relative levels are calculated as the ratio
of intensities of each ETS band to the cyclophilin band for each lane.
Error bars indicate SEM. Proteins were detected by western blotting (E
and F). Levels were quantified using Scion image and normalized
using β-actin as an internal standard (G and H).