Figure 3 of
Zhang, Mol Vis 2008; 14:1893-1897.
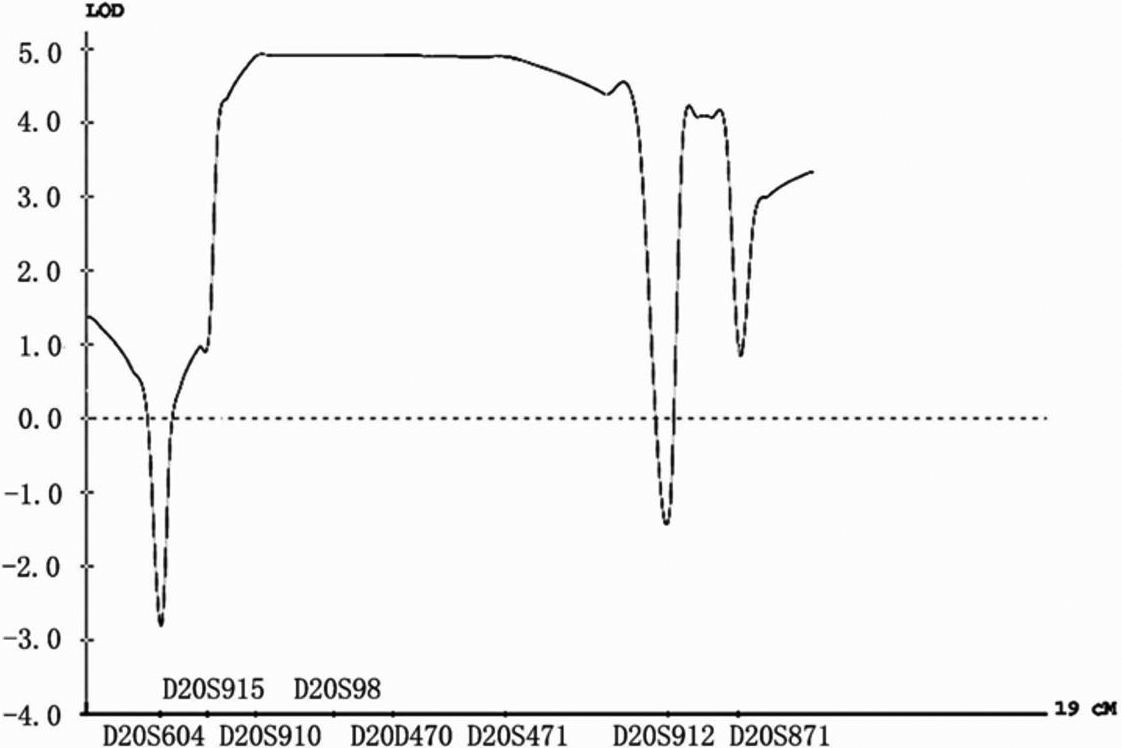
Figure 3.
Multipoint linkage analysis spanning 19 cM between total cataract phenotype and markers from D20S604 to D20S871 using the
GENEHUNTER 2.1
program. Genetic distance between the markers is as indicated in
Table 1
.