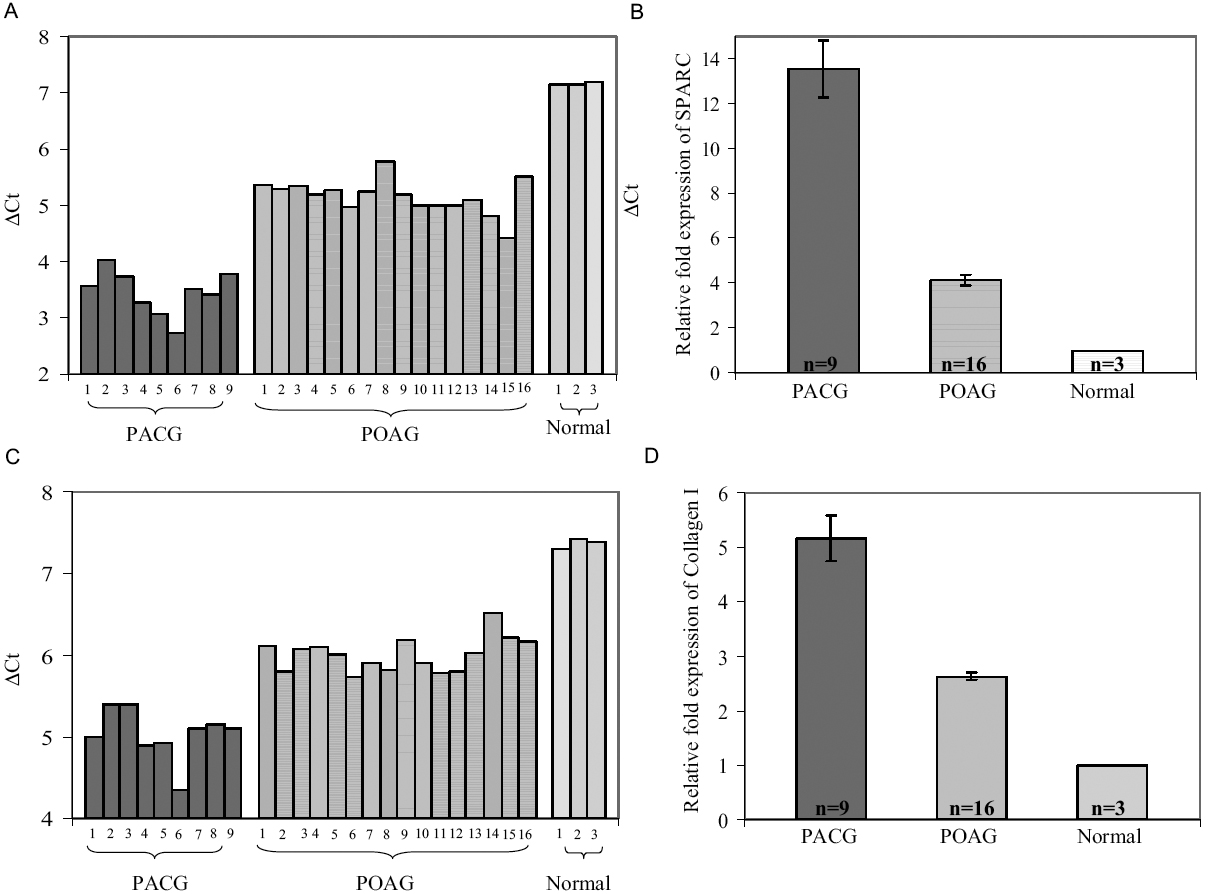
Figure 1. SPARC and collagen I mRNA
expression measured by quantitative real-time RT–PCR. Total RNA was
purified from the iris stroma of PACG (n=9), POAG (n=16), and normal
(n=3) subjects and analyzed by real-time quantitative RT–PCR. A:
SPARC mRNA expression in PACG, POAG, and non-glaucomatous iris
specimens is shown in the chart. The y axis (ΔCt) represents
SPARC expression normalized against β-actin expression. The data
revealed an overexpression of SPARC in the iris tissue from PACG and
POAG individuals relative to the iris tissue from non-glaucomatous
subjects. B: Fold expression of SPARC mRNA in PACG and POAG
relative to non-glaucomatous specimens is shown. The data illustrated
on the graph represent the mean±SEM of fold expression (2-∆Ct,PACG/∆Ct,POAG-∆Ct,normal)
of SPARC in PACG and POAG specimens relative to that in
non-glaucomatous specimens (fold expression=1). The PACG iris contained
a mean 13.6 fold and a mean 3.3 fold more SPARC than non-glaucomatous
and POAG iris (p<0.001), respectively. The POAG iris contained a
mean 4.1 fold more SPARC than non-glaucomatous iris. C:
Collagen I mRNA expression in PACG, POAG, and non-glaucomatous iris
specimens is shown. The y axis (ΔCt) represents collagen I
expression normalized against β-actin expression. The data revealed an
overexpression of collagen I in the iris from PACG and POAG individuals
relative to the iris from normal subjects. D: The fold
expression of collagen I mRNA in PACG and POAG relative to
non-glaucomatous specimens is given in the graph. The data illustrated
on the graph represent the mean±SEM of fold expression (2-∆Ct,PACG/∆Ct,POAG-∆Ct,normal)
of collagen I in PACG and POAG relative to that in non-glaucomatous
specimens (fold expression=1). The PACG iris contained a mean 5.2 fold
and a mean 2.0 fold more collagen I than non-glaucomatous and POAG iris
(p<0.001), respectively, and the POAG iris contained a mean 2.6 fold
more collagen I than non-glaucomatous iris.