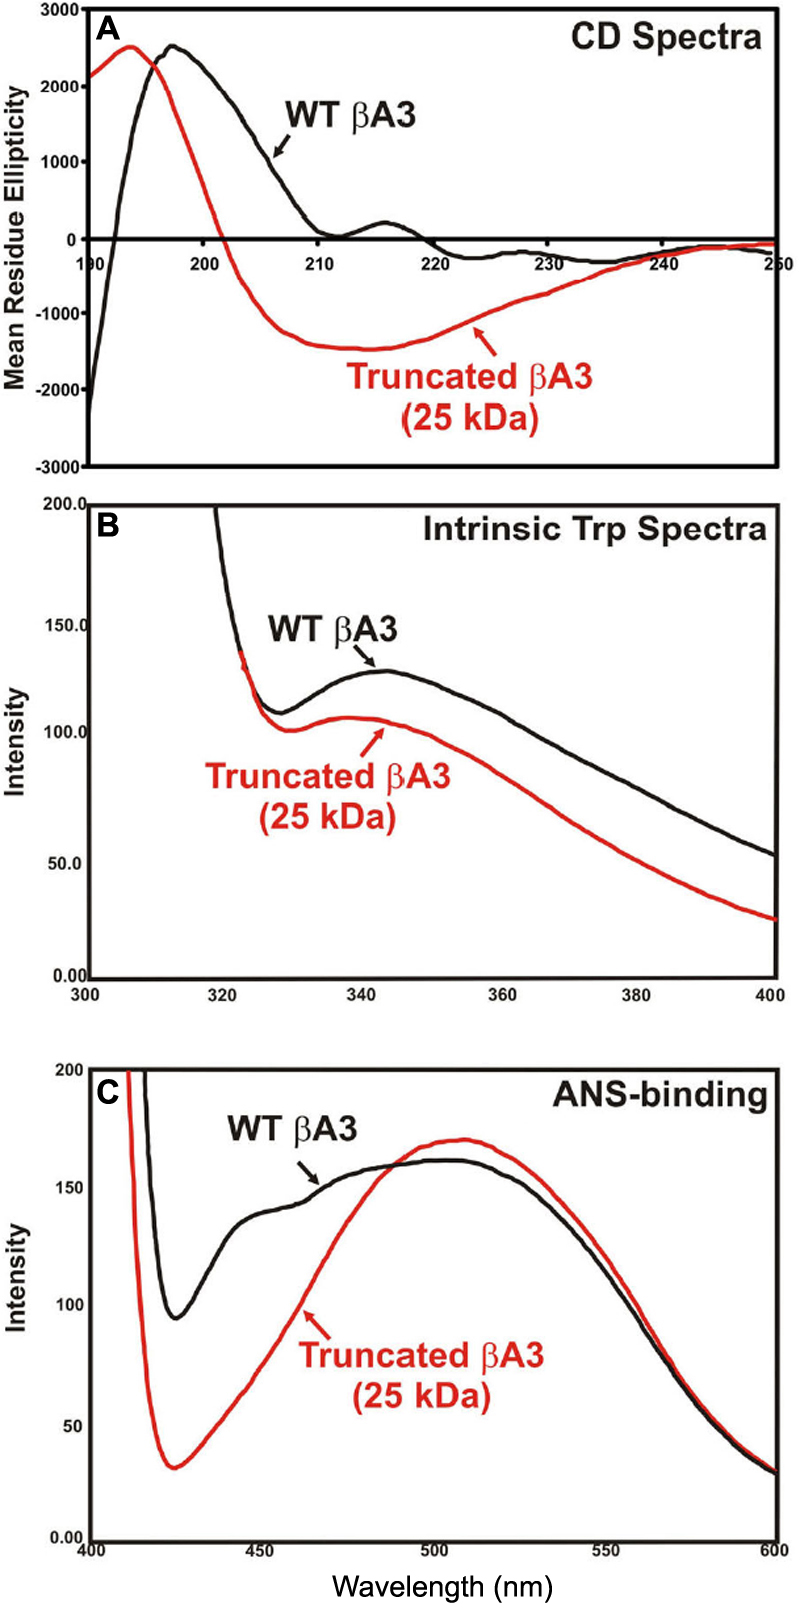
Figure 7. Structural changes in sodium
deoxycholate-treated, 25 kDa βA3-crystallin species with
proteinase activity compared to untreated, 32 kDa WT
βA3-crystallin without enzyme activity. These preparations were
obtained as described in
Figure 6.
A: The far
UV-CD spectra show that the truncated 25 kDa βA3-species (red line)
contains a greater level of alpha helical content than the WT-βA3
(black line).
B: The intrinsic Trp fluorescence spectra show a
red shift in the truncated 25 kDa βA3-species (red line) as compared to
the WT-βA3 (black line).
C: The fluorescence spectra after
ANS-binding show a blue shift in the truncated 25 kDa βA3-species (red
line) as compared to the WT-βA3 (black line).