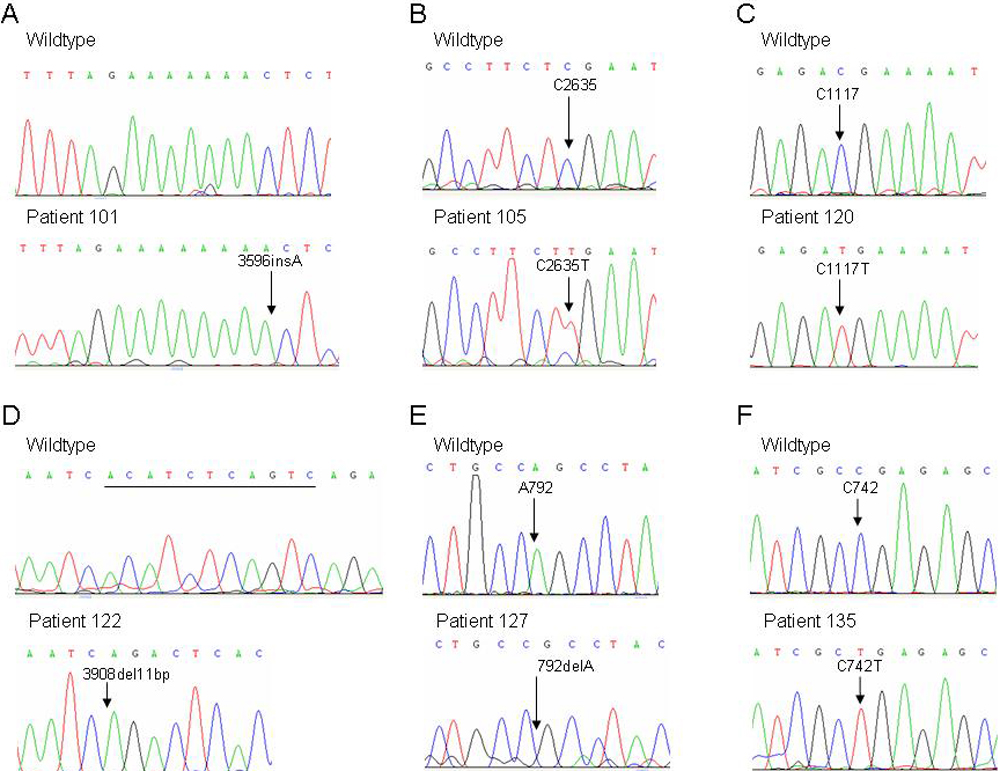
Figure 1. Chromatograms of identified
mutations. In each case, the wild type sequence is shown above the
mutated sequence for each patient. A shows the 3596insA in
patient 101; B shows the C2635T in patient 105; C shows
the C1117T in patient 120; D shows the 3908del11bp in patient
122; E shows the 792delA in patient 127; and F shows
the C742T in patient 135.