Figure 6. Rabbit lens α-crystallin
phosphorylation. A shows the optical scan of a rabbit lens
equatorial cryosection before MALDI matrix deposition. B shows
the distribution of full-length αA-crystallin. C:
Singly-phosphorylated full-length αA-crystallin (observed m/z=19953)
shows higher abundance in the middle cortex. D: The dual color
image shows the relationship between the spatial distributions of
full-length αA-crystallin (red) and phosphorylated αA-crystallin
(green). Both full-length αB-crystallin (E; residues 1–175,
observed m/z=20146) and the singly-phosphorylated αB-crystallin
(F; observed m/z=20215) show higher abundance in the
middle cortex. G: The dual color image shows the relationship
between the spatial distributions of full-length αB-crystallin (red)
and phosphorylated αB-crystallin (green). Yellow coloration indicates
colocalization. P=phosphorylated form of protein. Scale bar=2 mm.
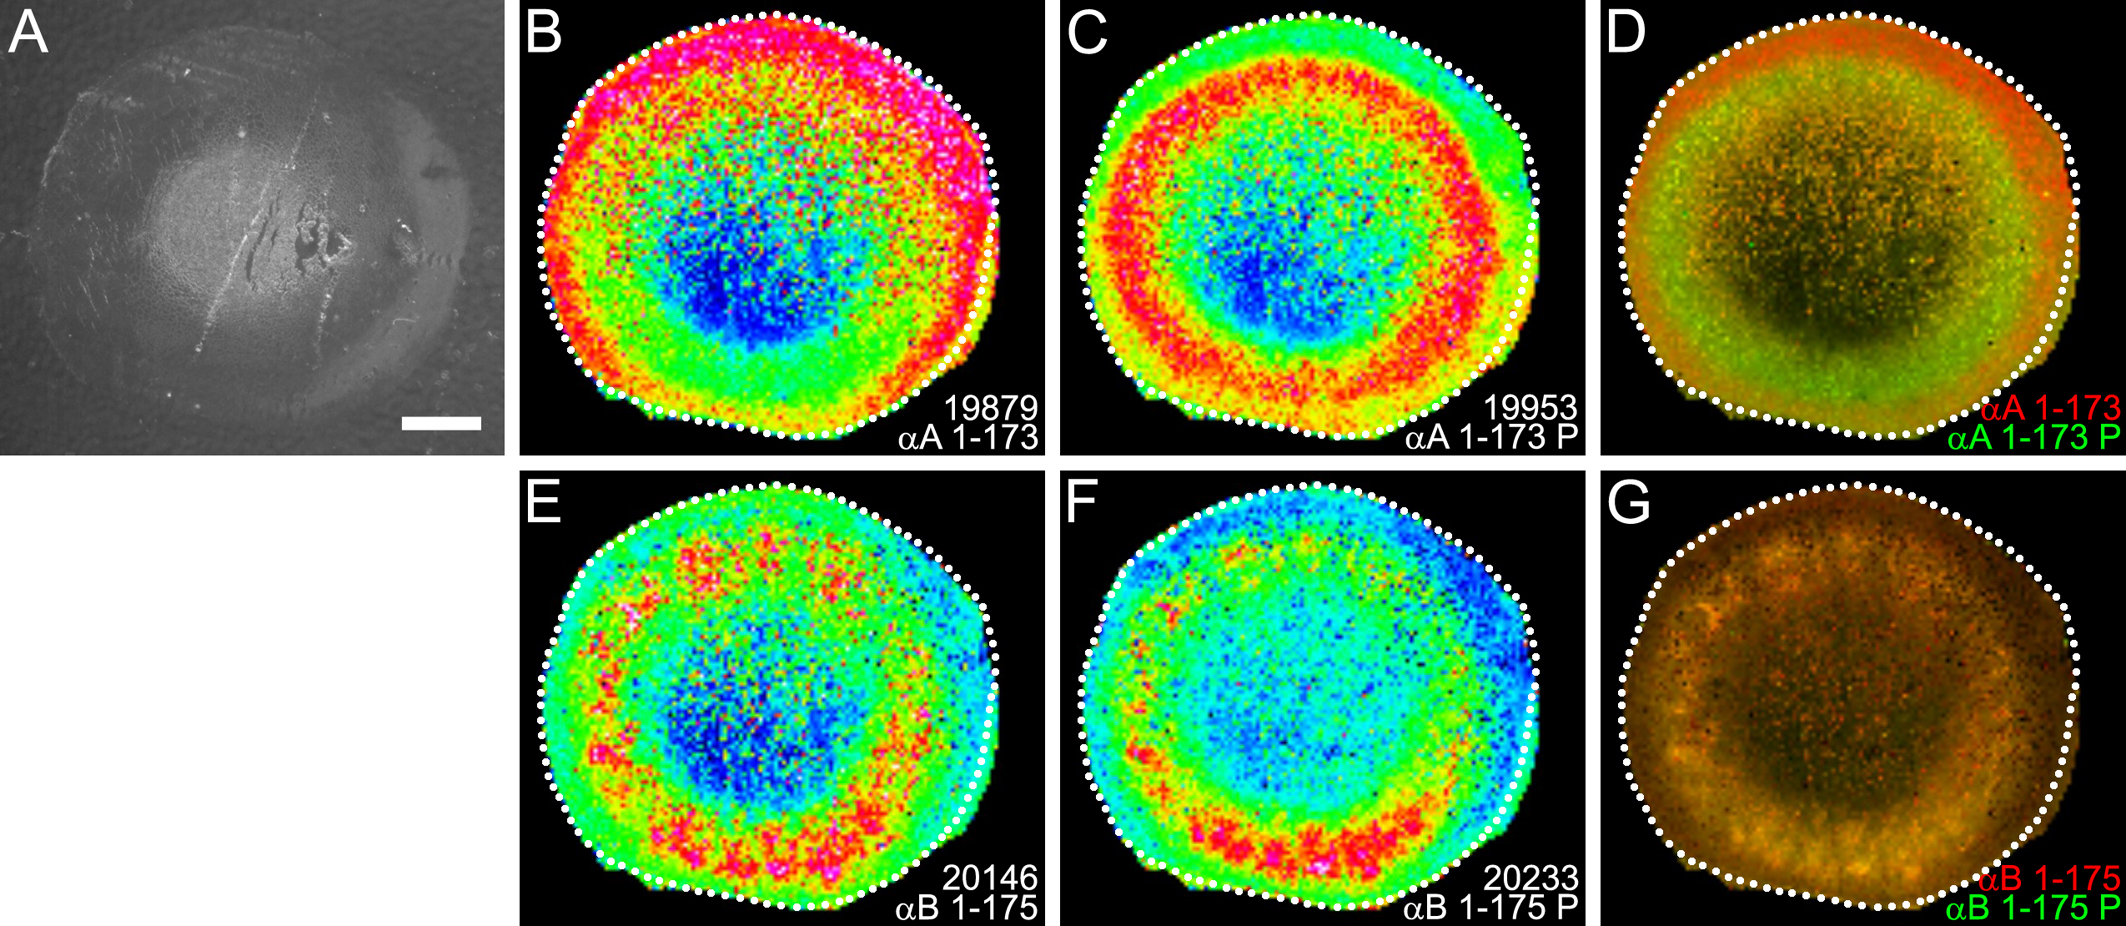
 Figure 6 of Grey, Mol Vis 2008; 14:171-179.