Figure 5. Bovine lens α-crystallin
phosphorylation. A shows the optical scan of a bovine lens
equatorial cryosection before MALDI matrix deposition. B
illustrates the distribution of full-length αA-crystallin. C:
Singly-phosphorylated full-length αA-crystallin (observed m/z=19920)
shows higher abundance in the middle cortex. D: The dual color
image shows the relationship between the spatial distributions of
full-length αA-crystallin (red) and phosphorylated αA-crystallin
(green). E: The distribution of full-length αB-crystallin
(residues 1–175, observed m/z=20084) showed higher abundance
toward the edge of the lens and in the inner cortex. Singly-
phosphorylated (F) and doubly- phosphorylated (G)
αB-crystallin (observed m/z=20163 and 20248, respectively) are
more abundant in the middle cortex. H: The dual color image
shows the relationship between the spatial distributions of full-length
αB-crystallin (red) and doubly-phosphorylated αB-crystallin (green).
P/2P=phosphorylated forms of protein. Scale bar=2 mm.
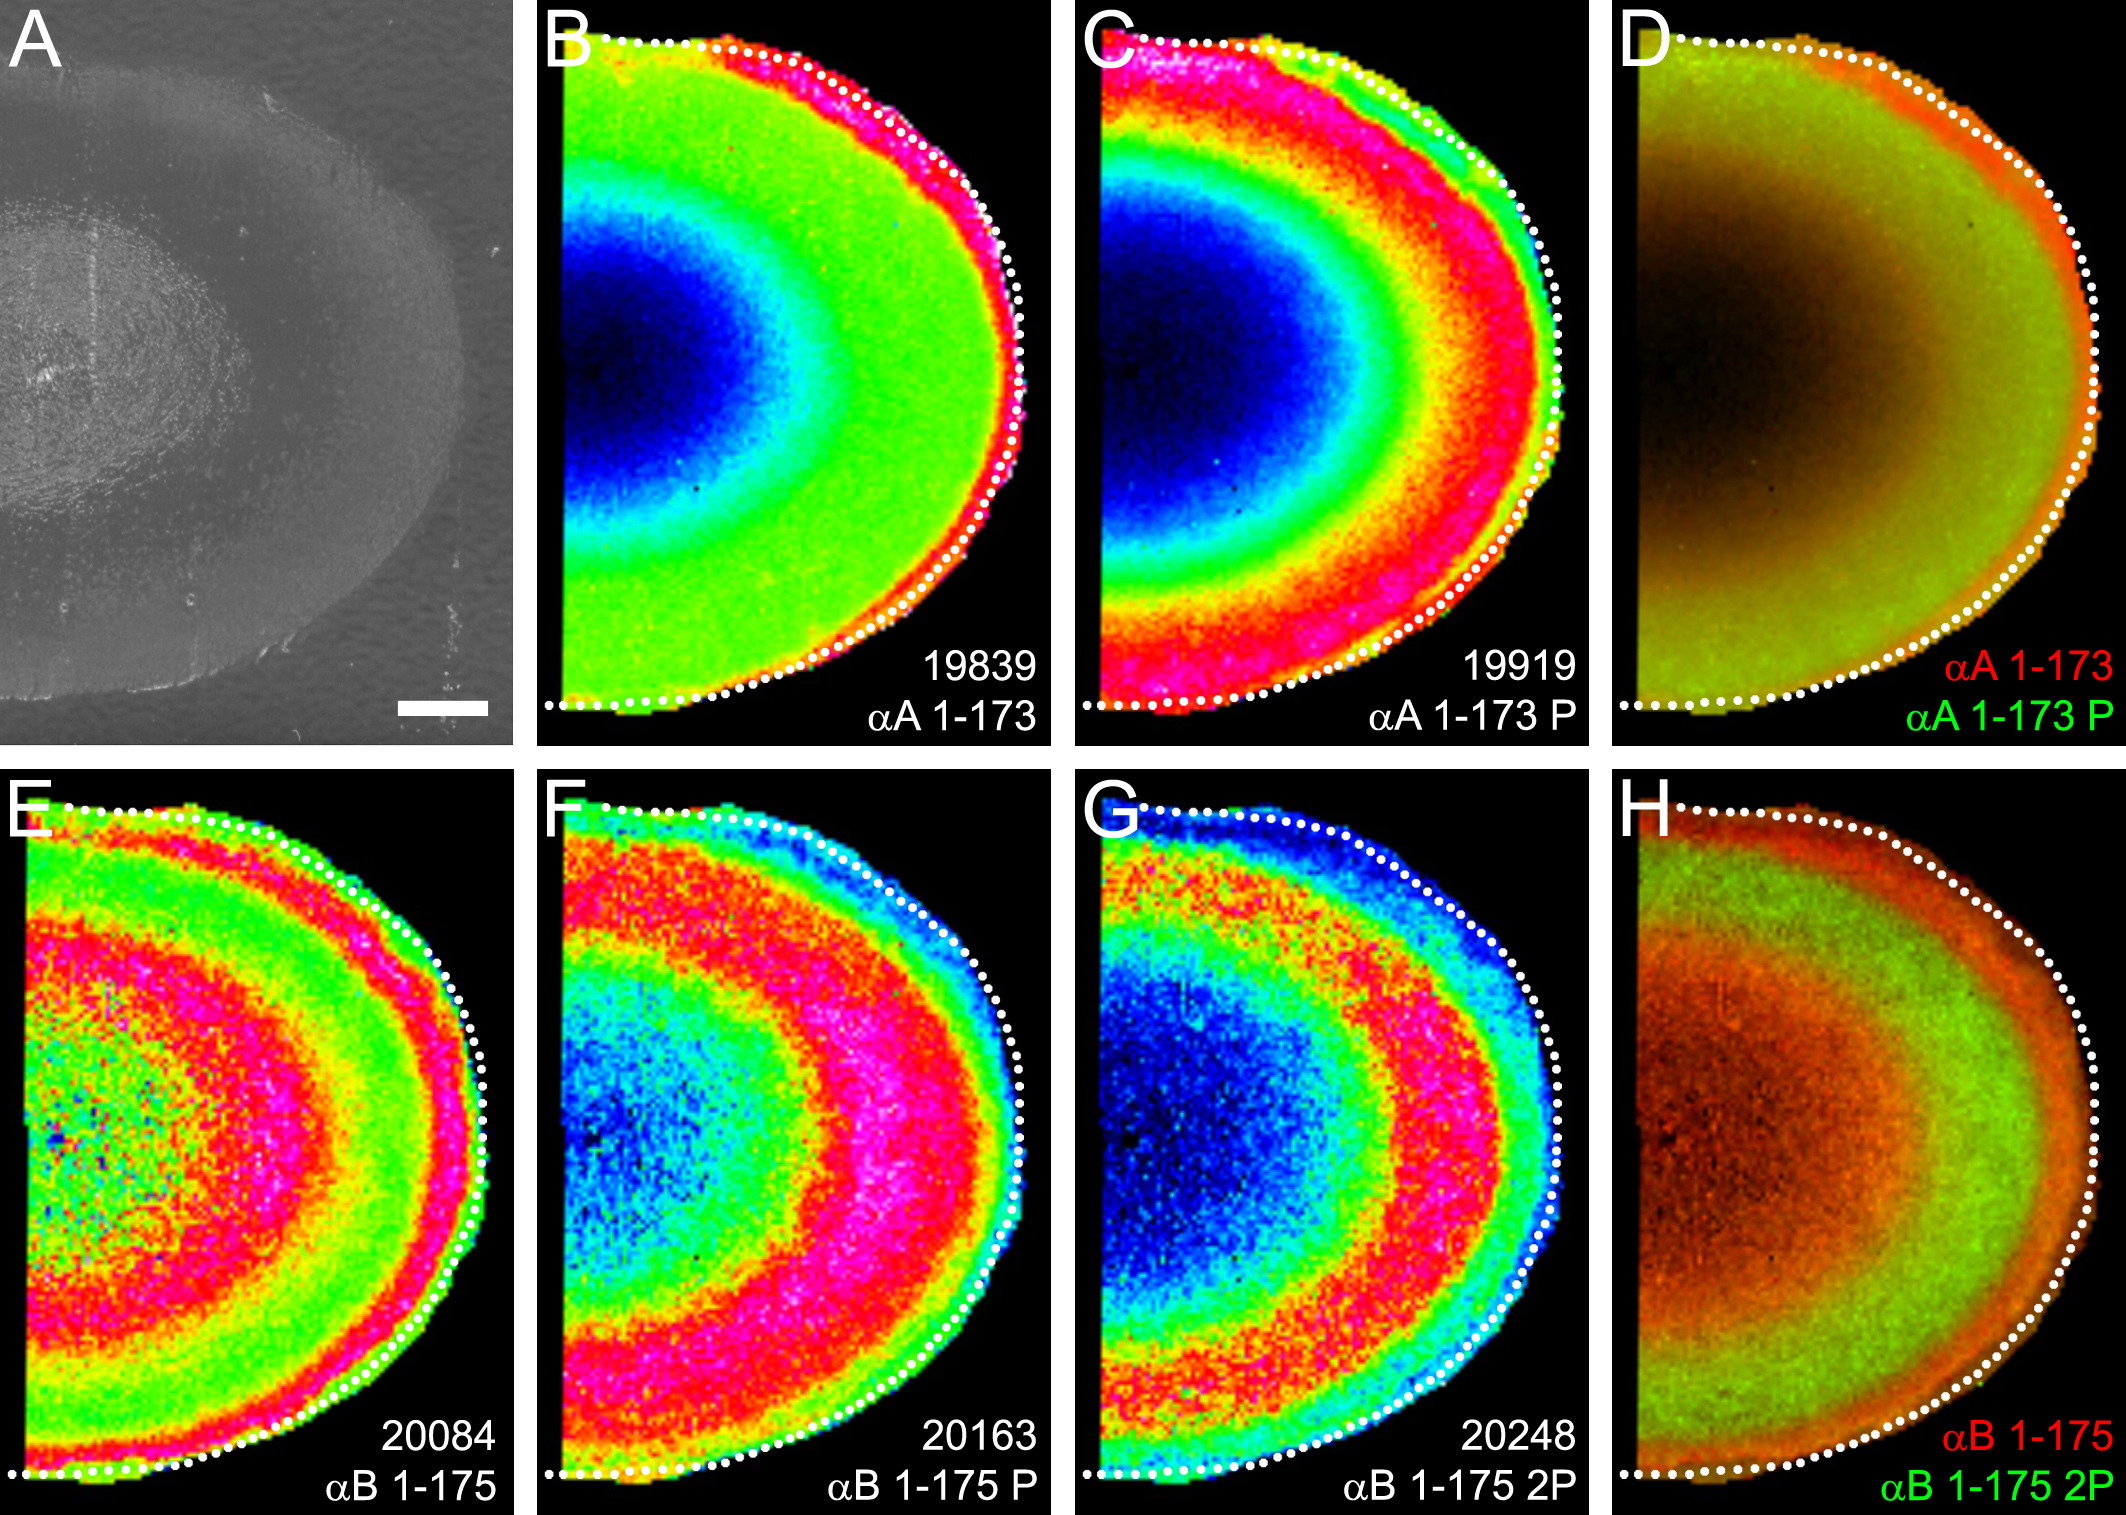
 Figure 5 of Grey, Mol Vis 2008; 14:171-179.