Figure 3. Rabbit lens αA-crystallin
degradation. A shows the optical scan of a rabbit lens
equatorial cryosection before MALDI matrix deposition. (B-K)
MALDI molecular images indicate the distribution of the major forms of
αA-crystallin in the rabbit lenses. The identities and observed m/z
of these truncation products are (B) 1–173, m/z=19879, (C)
αA or αB 1–168, m/z=19449, (D) 1–163, m/z=18883,
(E) 1–151, m/z=17618, (F) 1–101, m/z=12011,
(G) 1–85, m/z=10147, (H) 1–65, m/z=7759, (I)
1–58, m/z=7028, and (J) 1–50, m/z=6096. K:
The molecular image shows the relationship of a full-length
αA-crystallin (red) to its most abundant truncation products, 1–101
(green) and 1–151 (blue), which are found exclusively in the lens
nucleus. Scale bar=2 mm.
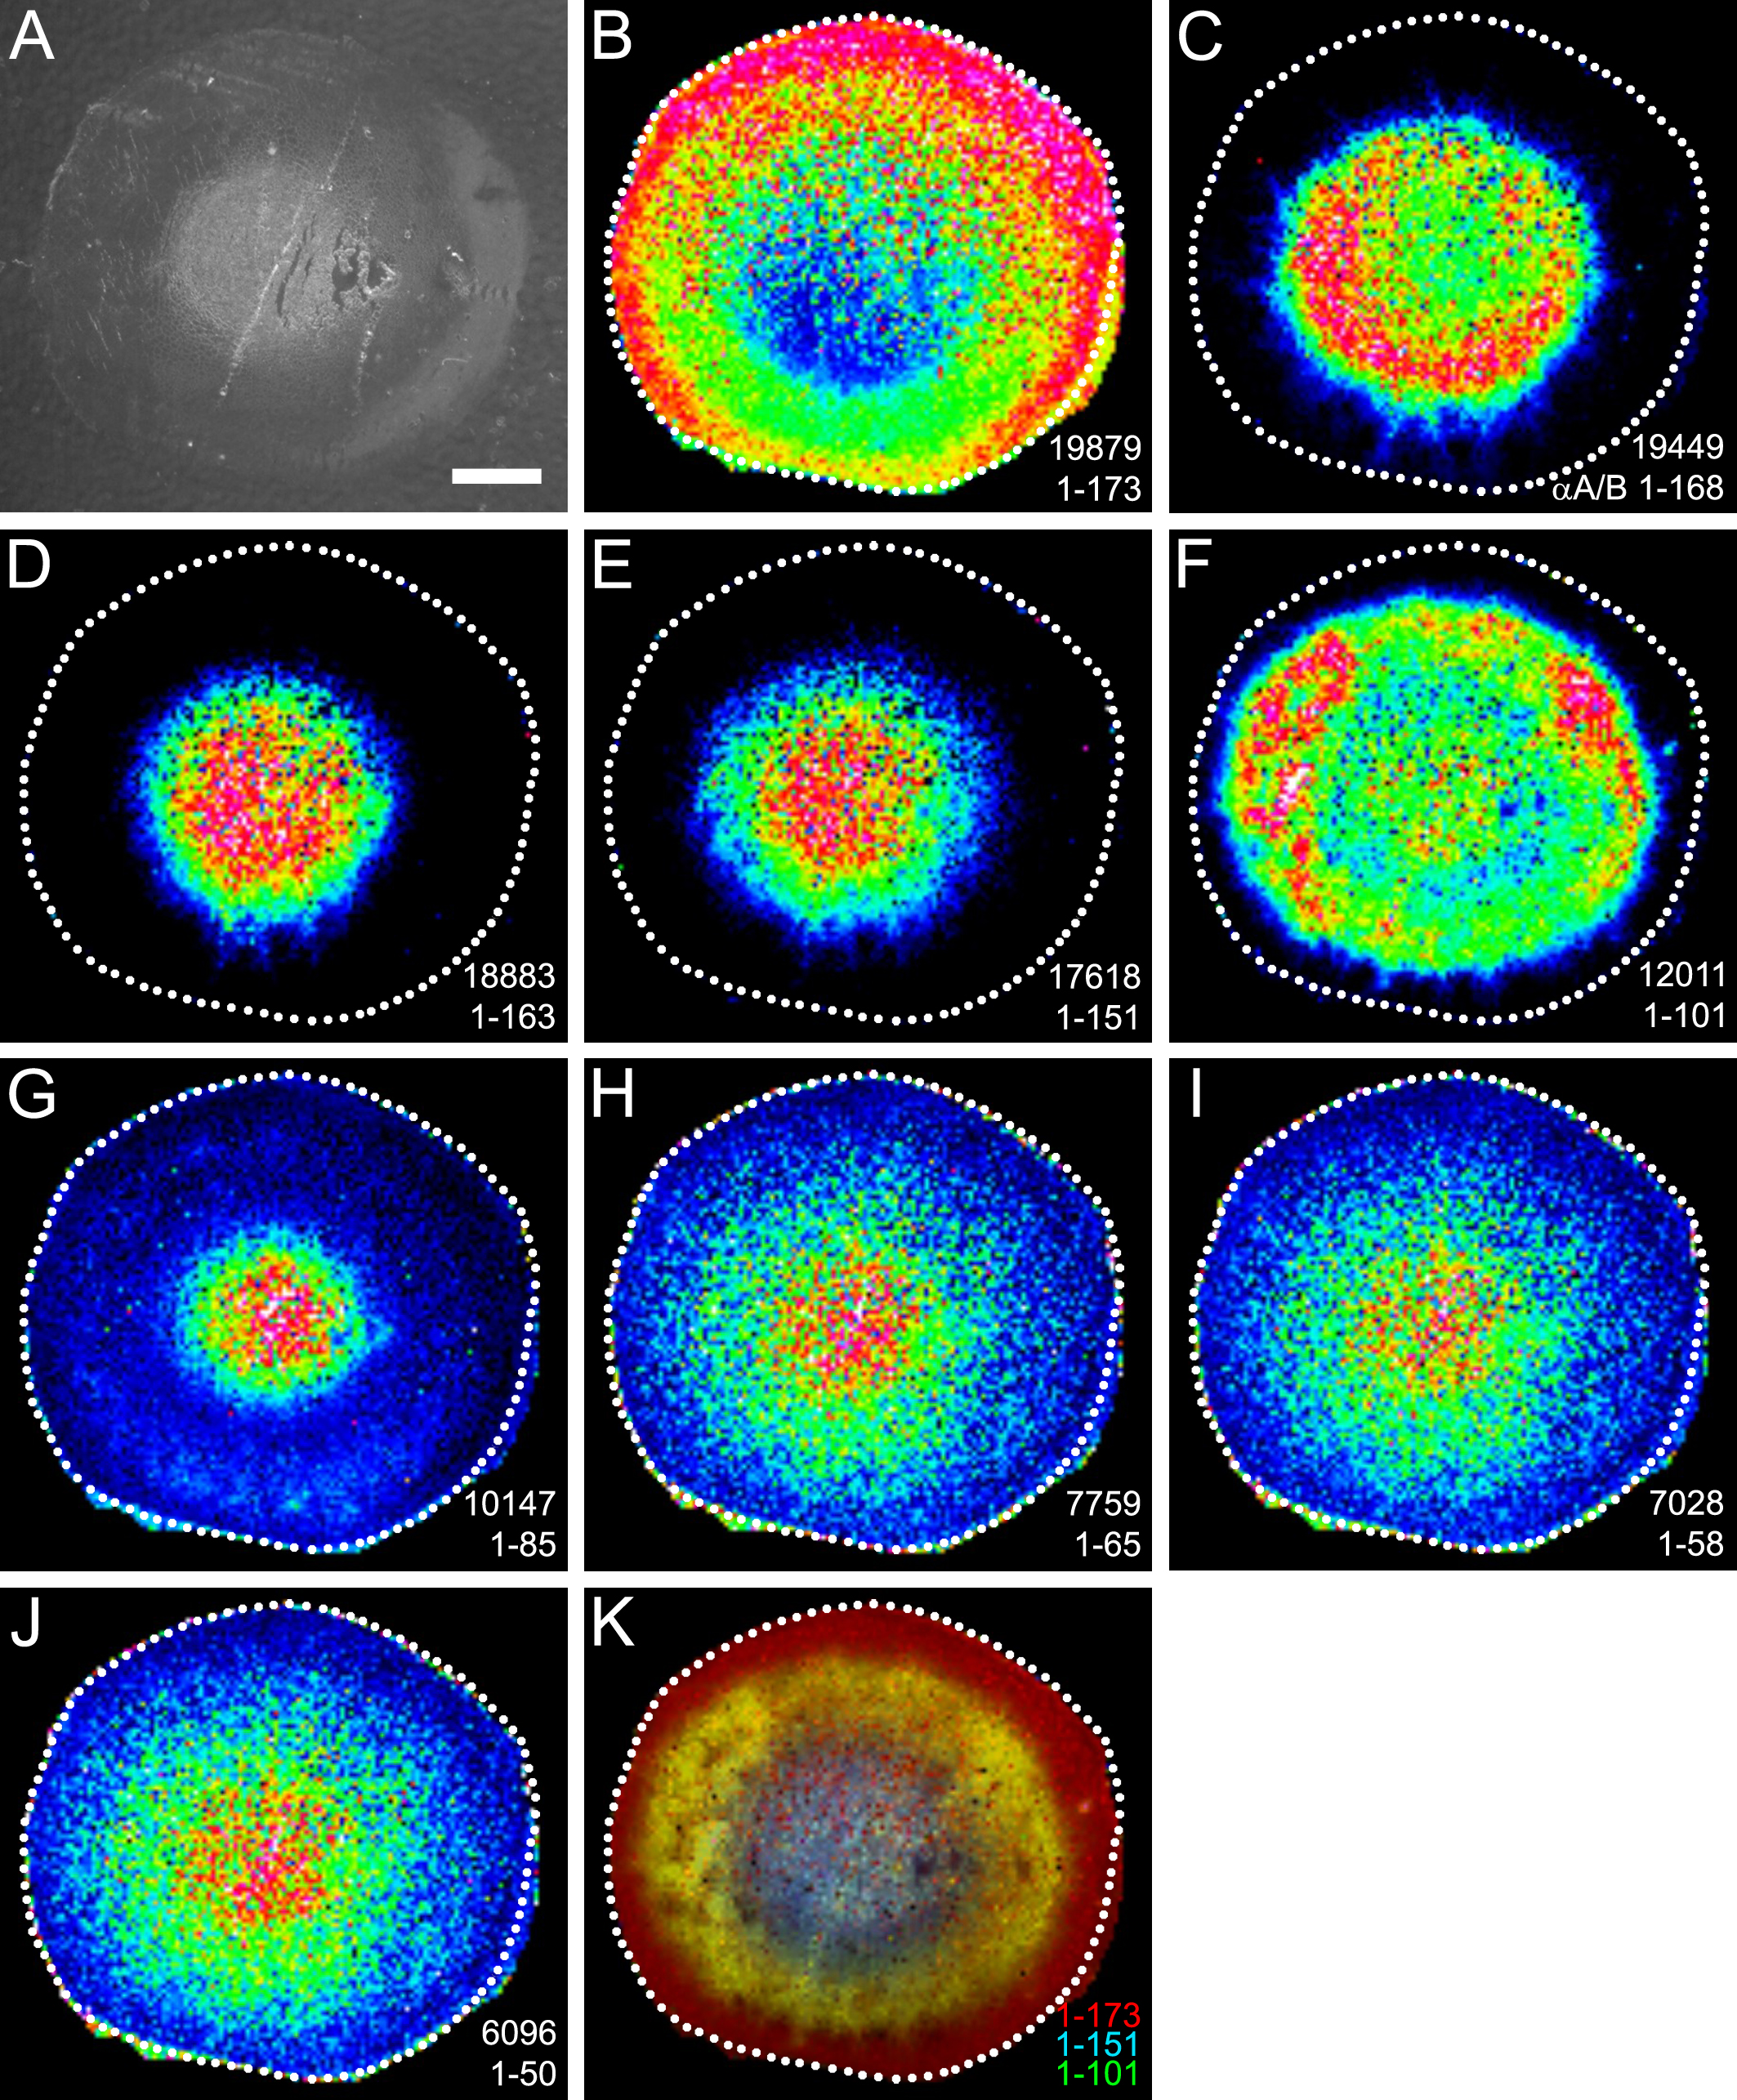
 Figure 3 of Grey, Mol Vis 2008; 14:171-179.