Figure 2. Bovine lens αA-crystallin
degradation. A shows the optical scan of a bovine lens
equatorial cryosection before MALDI matrix deposition. MALDI molecular
images indicate the distribution of full-length αA-crystallin (1–173, m/z=19838)
(B) and its major truncation products (C-H) in
bovine lenses. The identities and observed m/z of these
truncation products are (C) 1–151, m/z=17581, (D)
1–101, m/z=11999, (E) 1–80, m/z=9594, (F)
1–65, m/z=7745, (G) 1–58, m/z=7017, and (H)
1–50, m/z=6083. I: The rainbow scale was used to plot
all single m/z molecular images. Scale bar=2 mm.
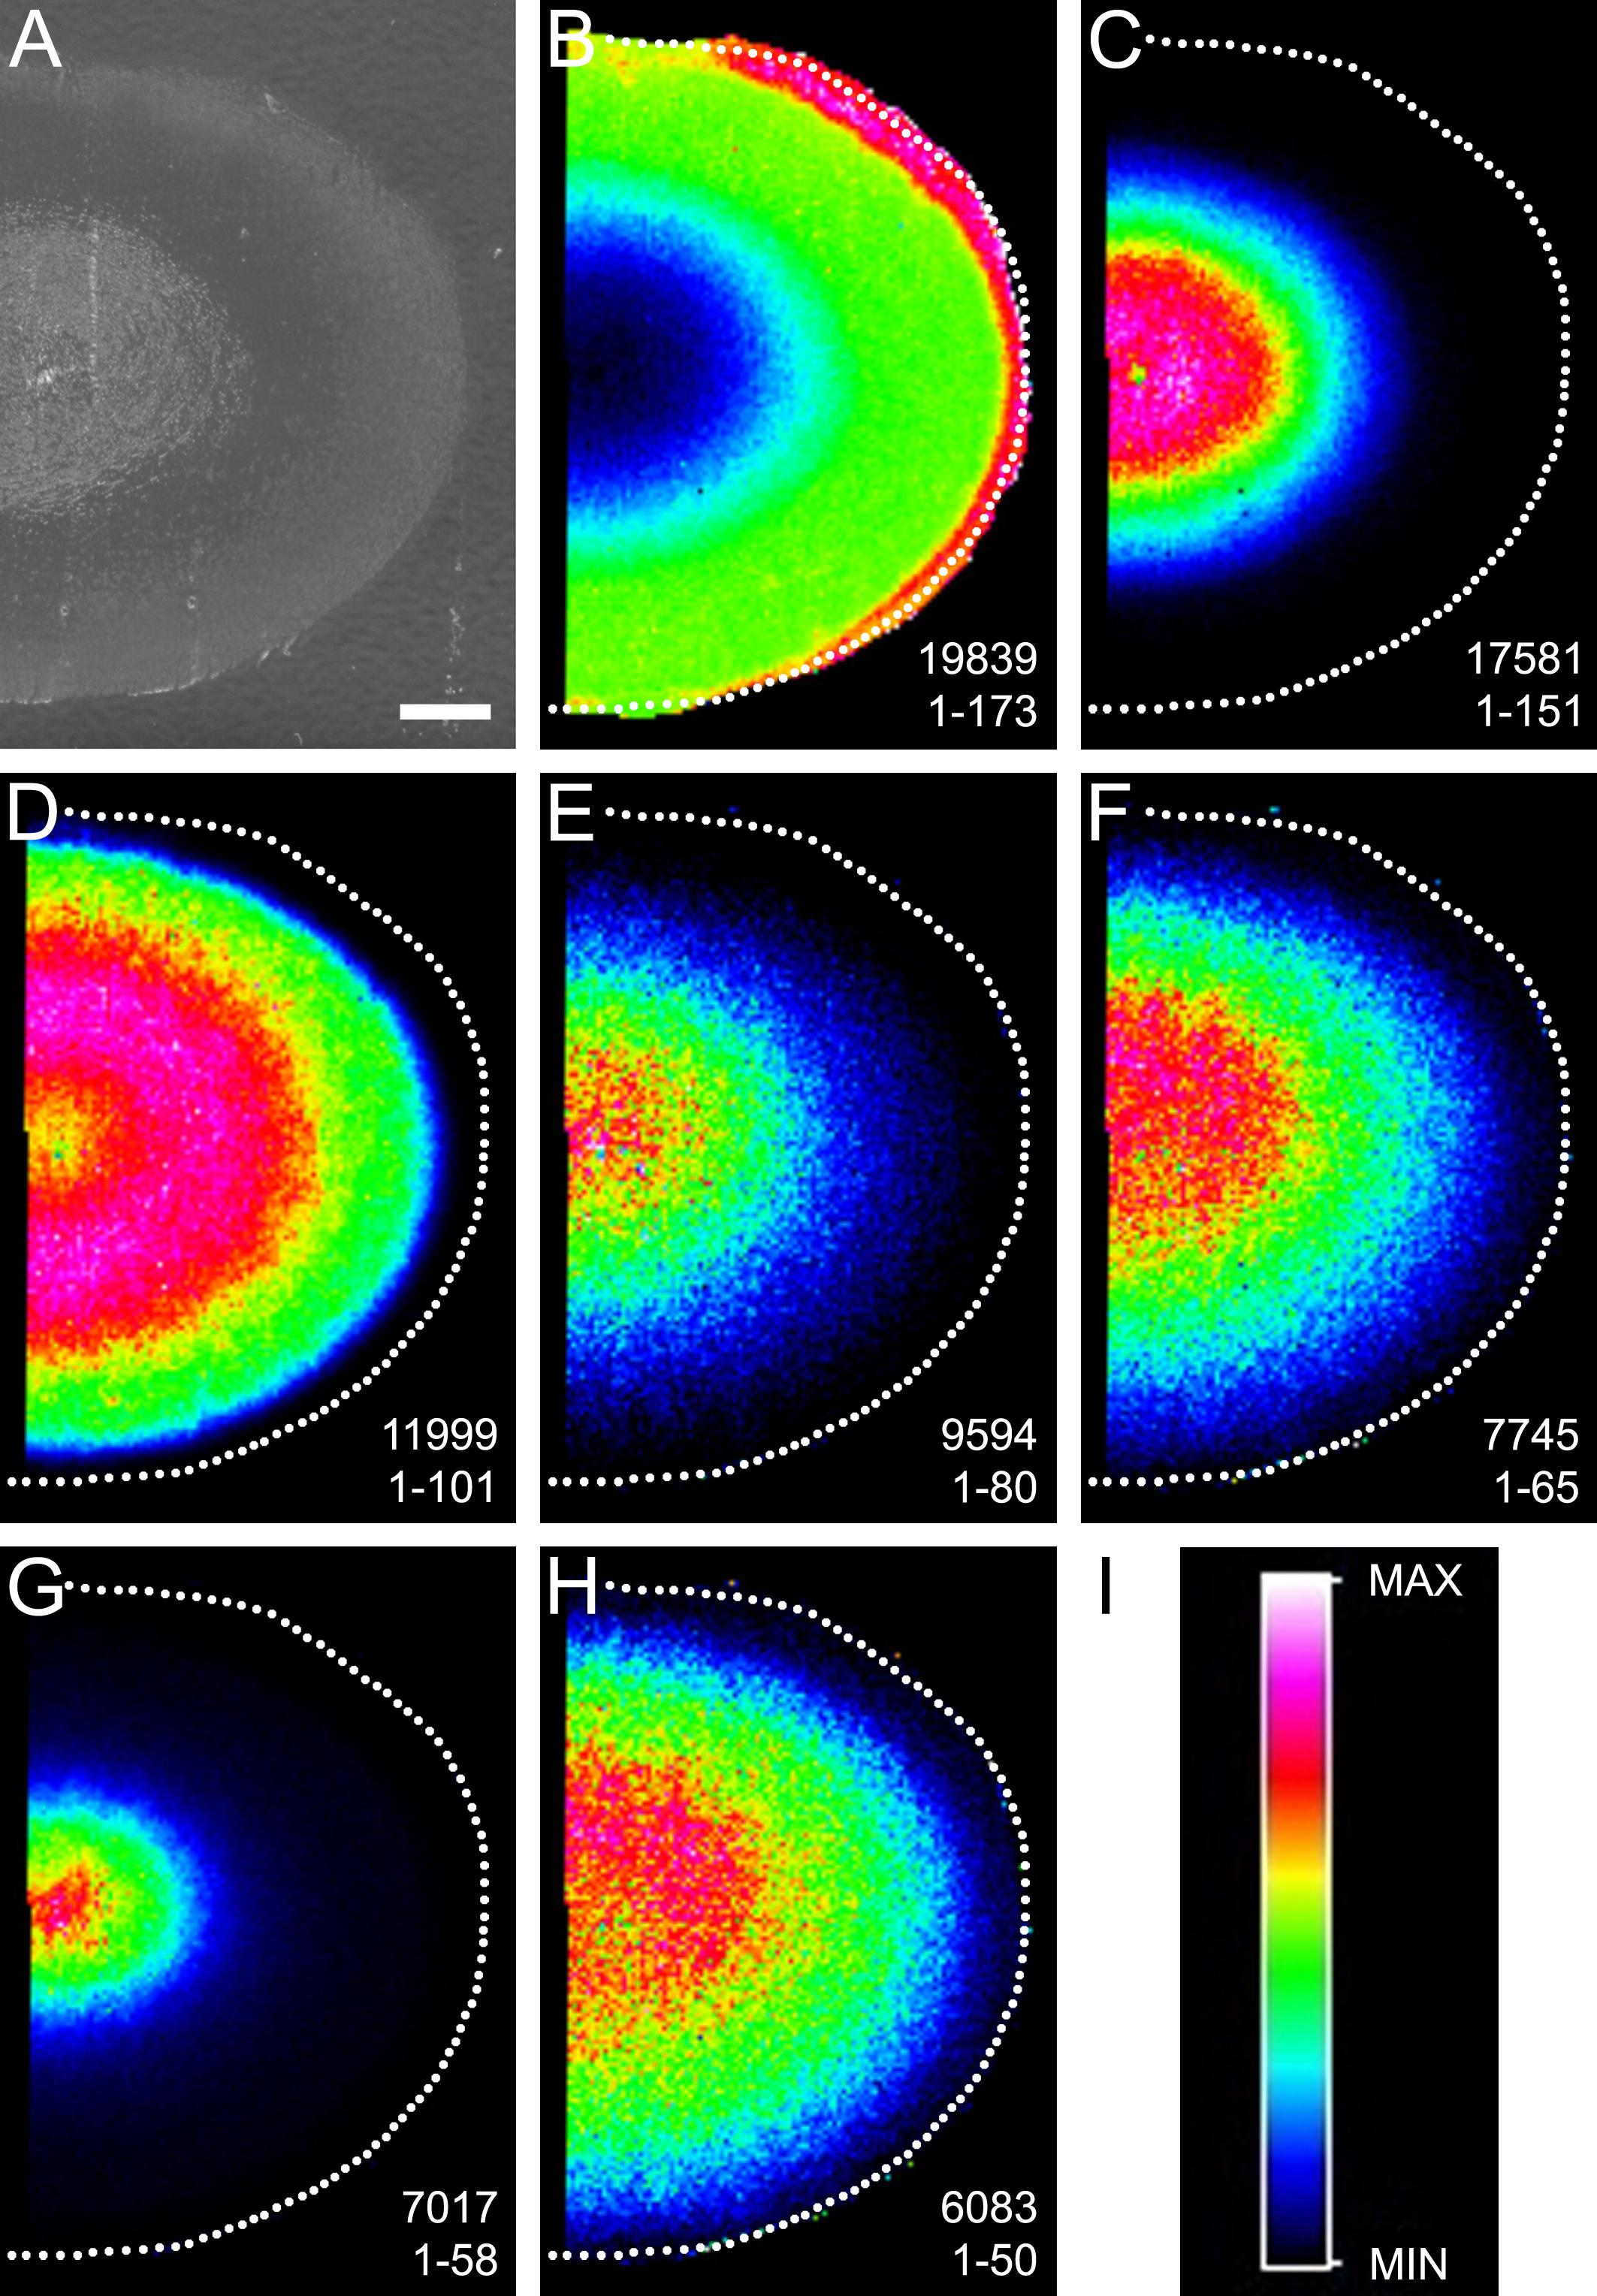
 Figure 2 of Grey, Mol Vis 2008; 14:171-179.