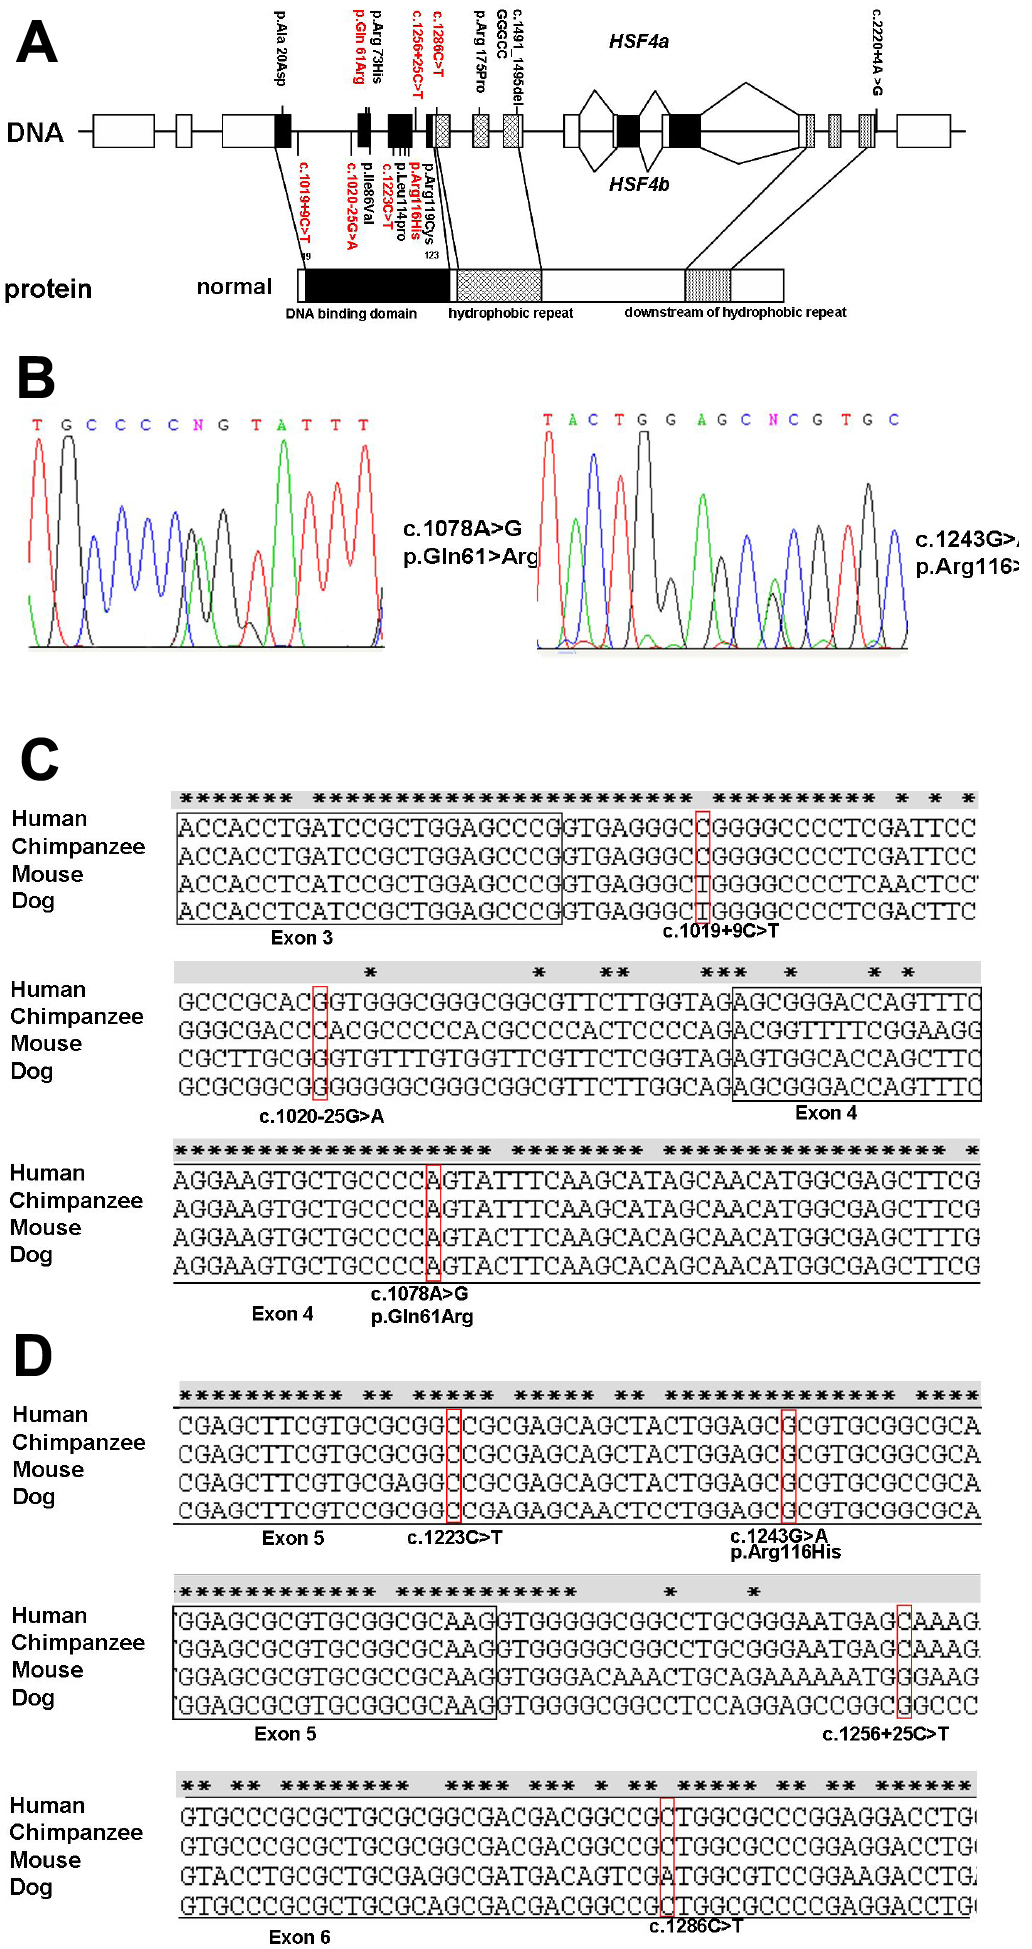
Figure 1. Distribution of variants in HSF4.
Mutations reported in this study are highlighted in red; previously
reported mutations are highlighted in black. A: HSF4
structure is shown in the diagram with the locations of the mutations
labeled. B: Genomic DNA sequence electropherograms of the two
new missense mutations are shown. Left panel, sequence
electropherograms from an affected patient heterozygous for the
c.1078A>G mutation resulting in a p.Gln61>Arg substitution; right
panel, sequence electropherograms from an affected patient heterozygous
for the c.1243G>A mutation resulting in a p.Arg116>His
substitution. C: HSF4 sequence alignment and reported
mutations in this study are given and highlighted.