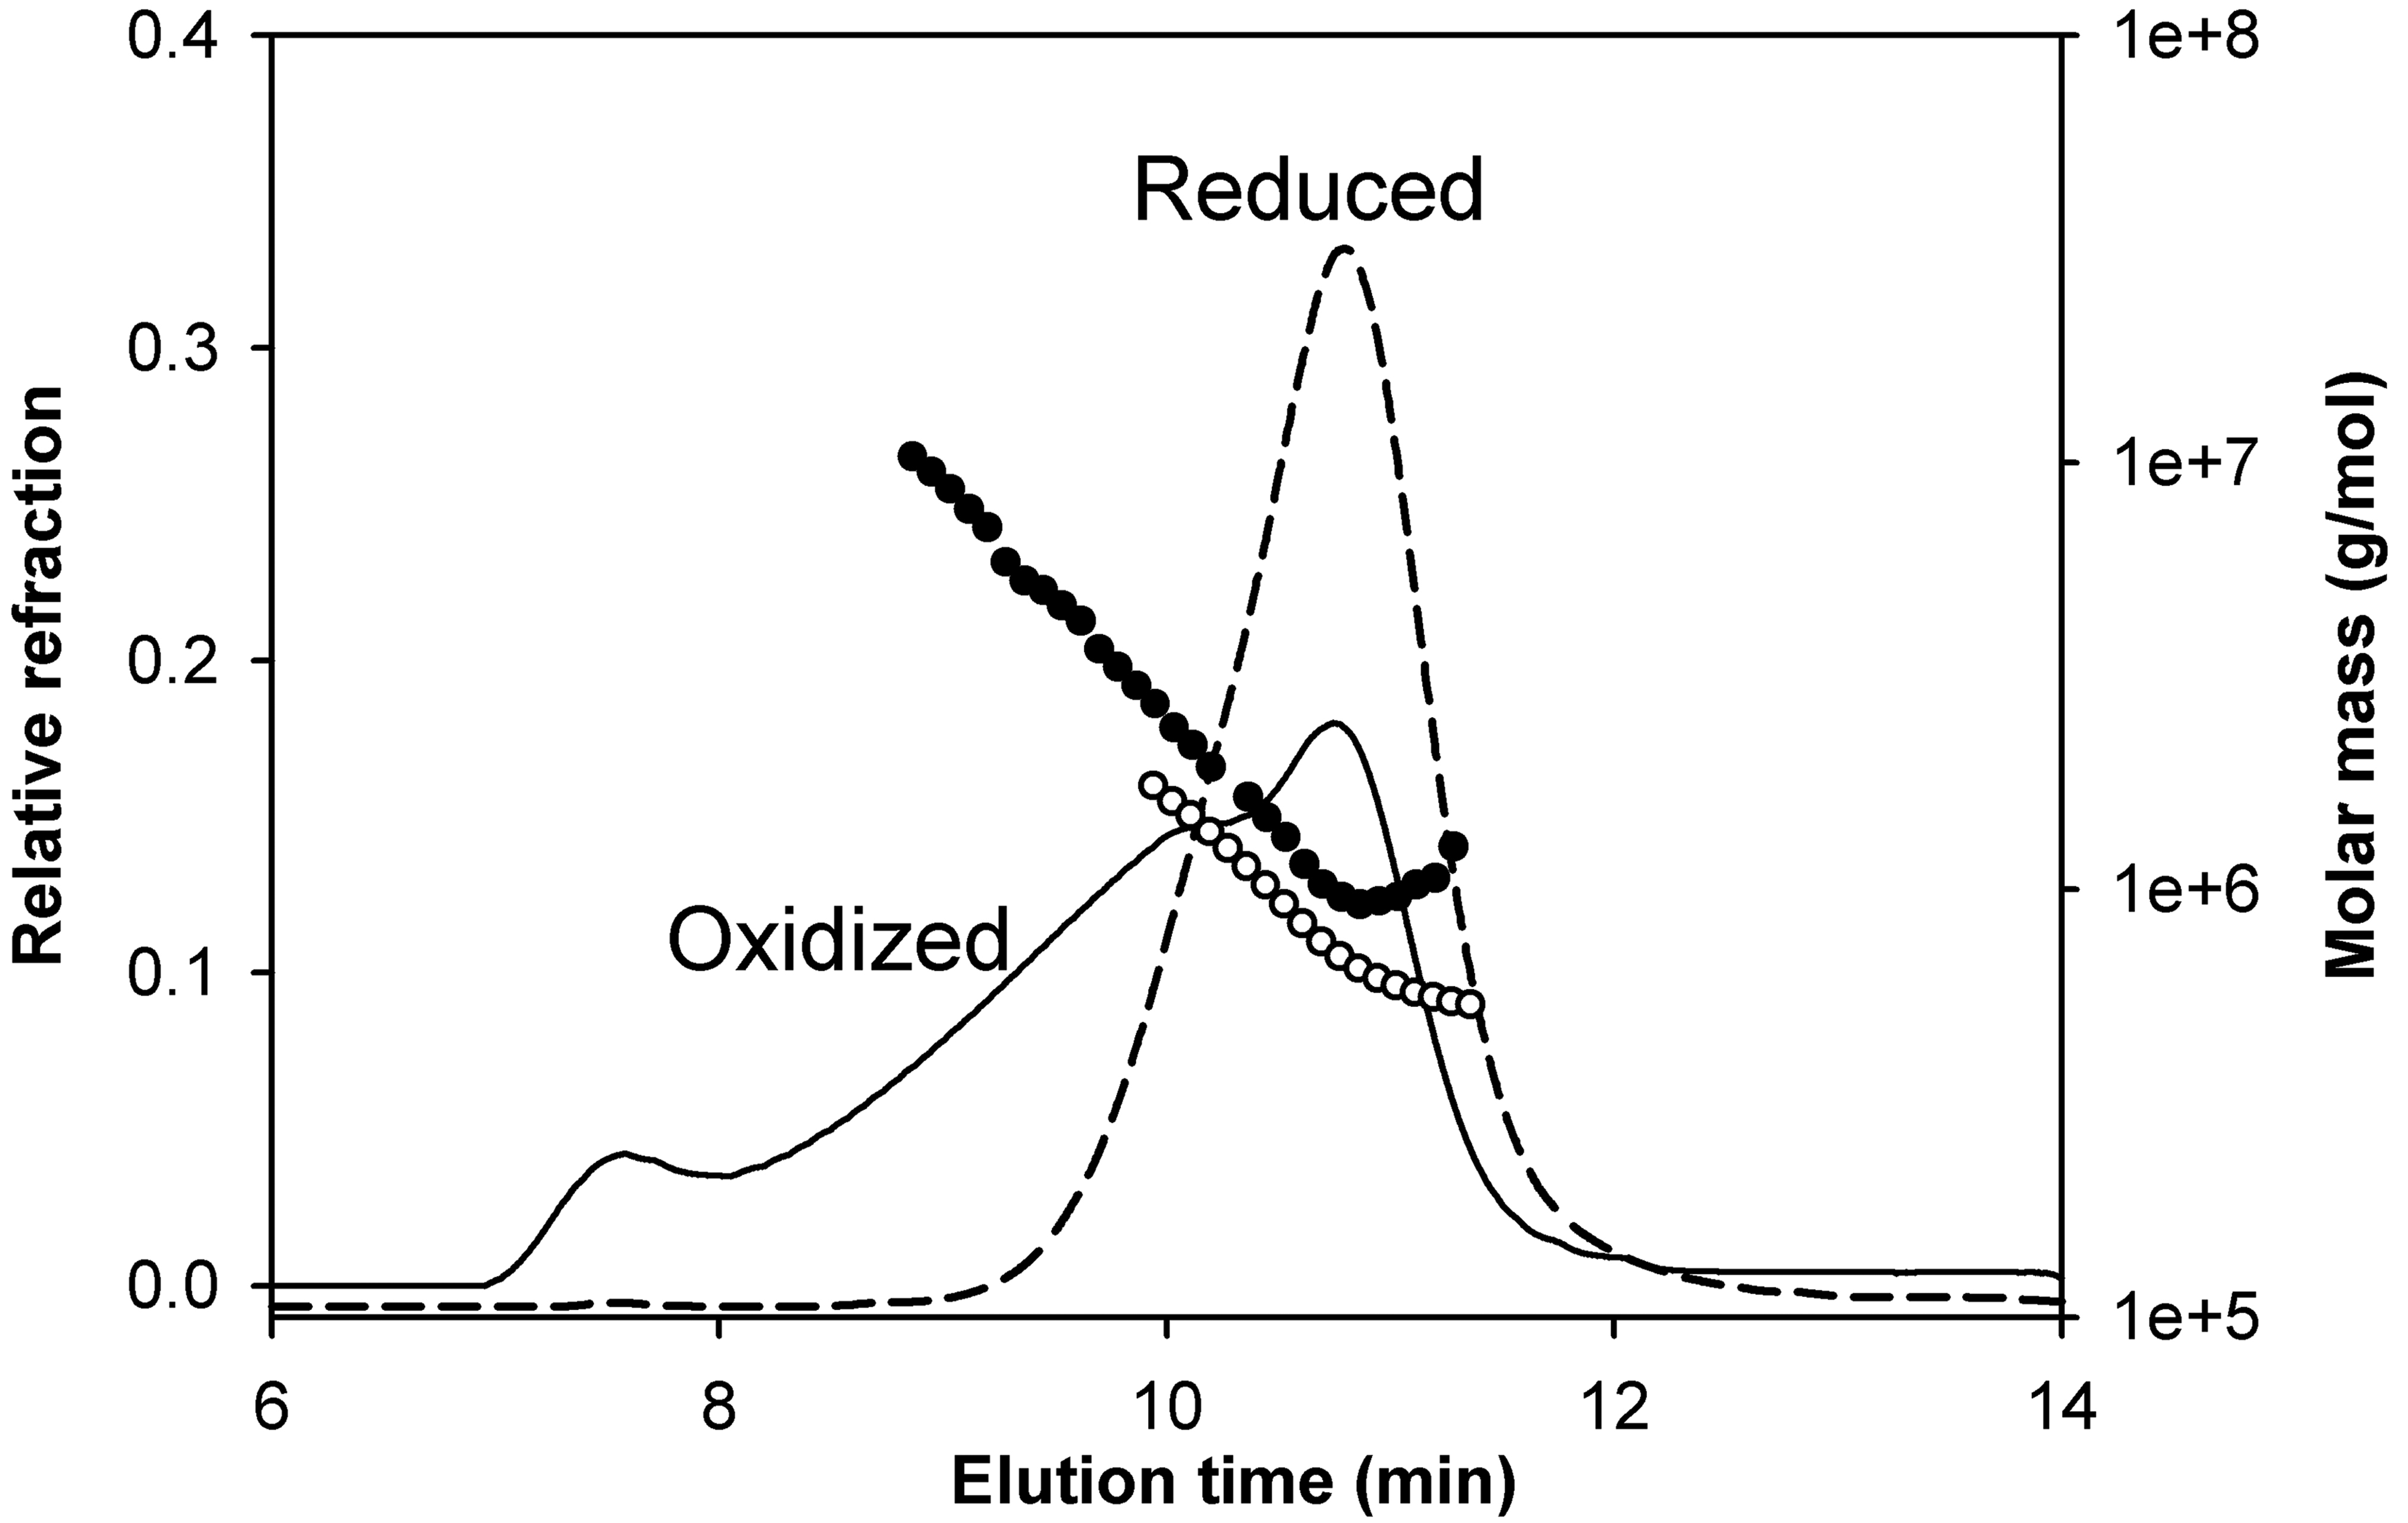
Figure 3. Molecular mass distribution and
elution profile of oxidized and reduced αBT162C protein. Protein (0.1
mg each) in buffer was injected into a TSK5000 gel filtration column
connected to a multi-angle light scattering instrument, and the data
was analyzed as described under Methods. Solid line and filled circle,
oxidized αBT162C; broken line and unfilled circle, reduced αBT162C. A
broad elution peak for the oxidized αBT162C protein suggests
that the cysteine mutant forms heterogeneous aggregates with
wide-range of molecular species upon oxidation.