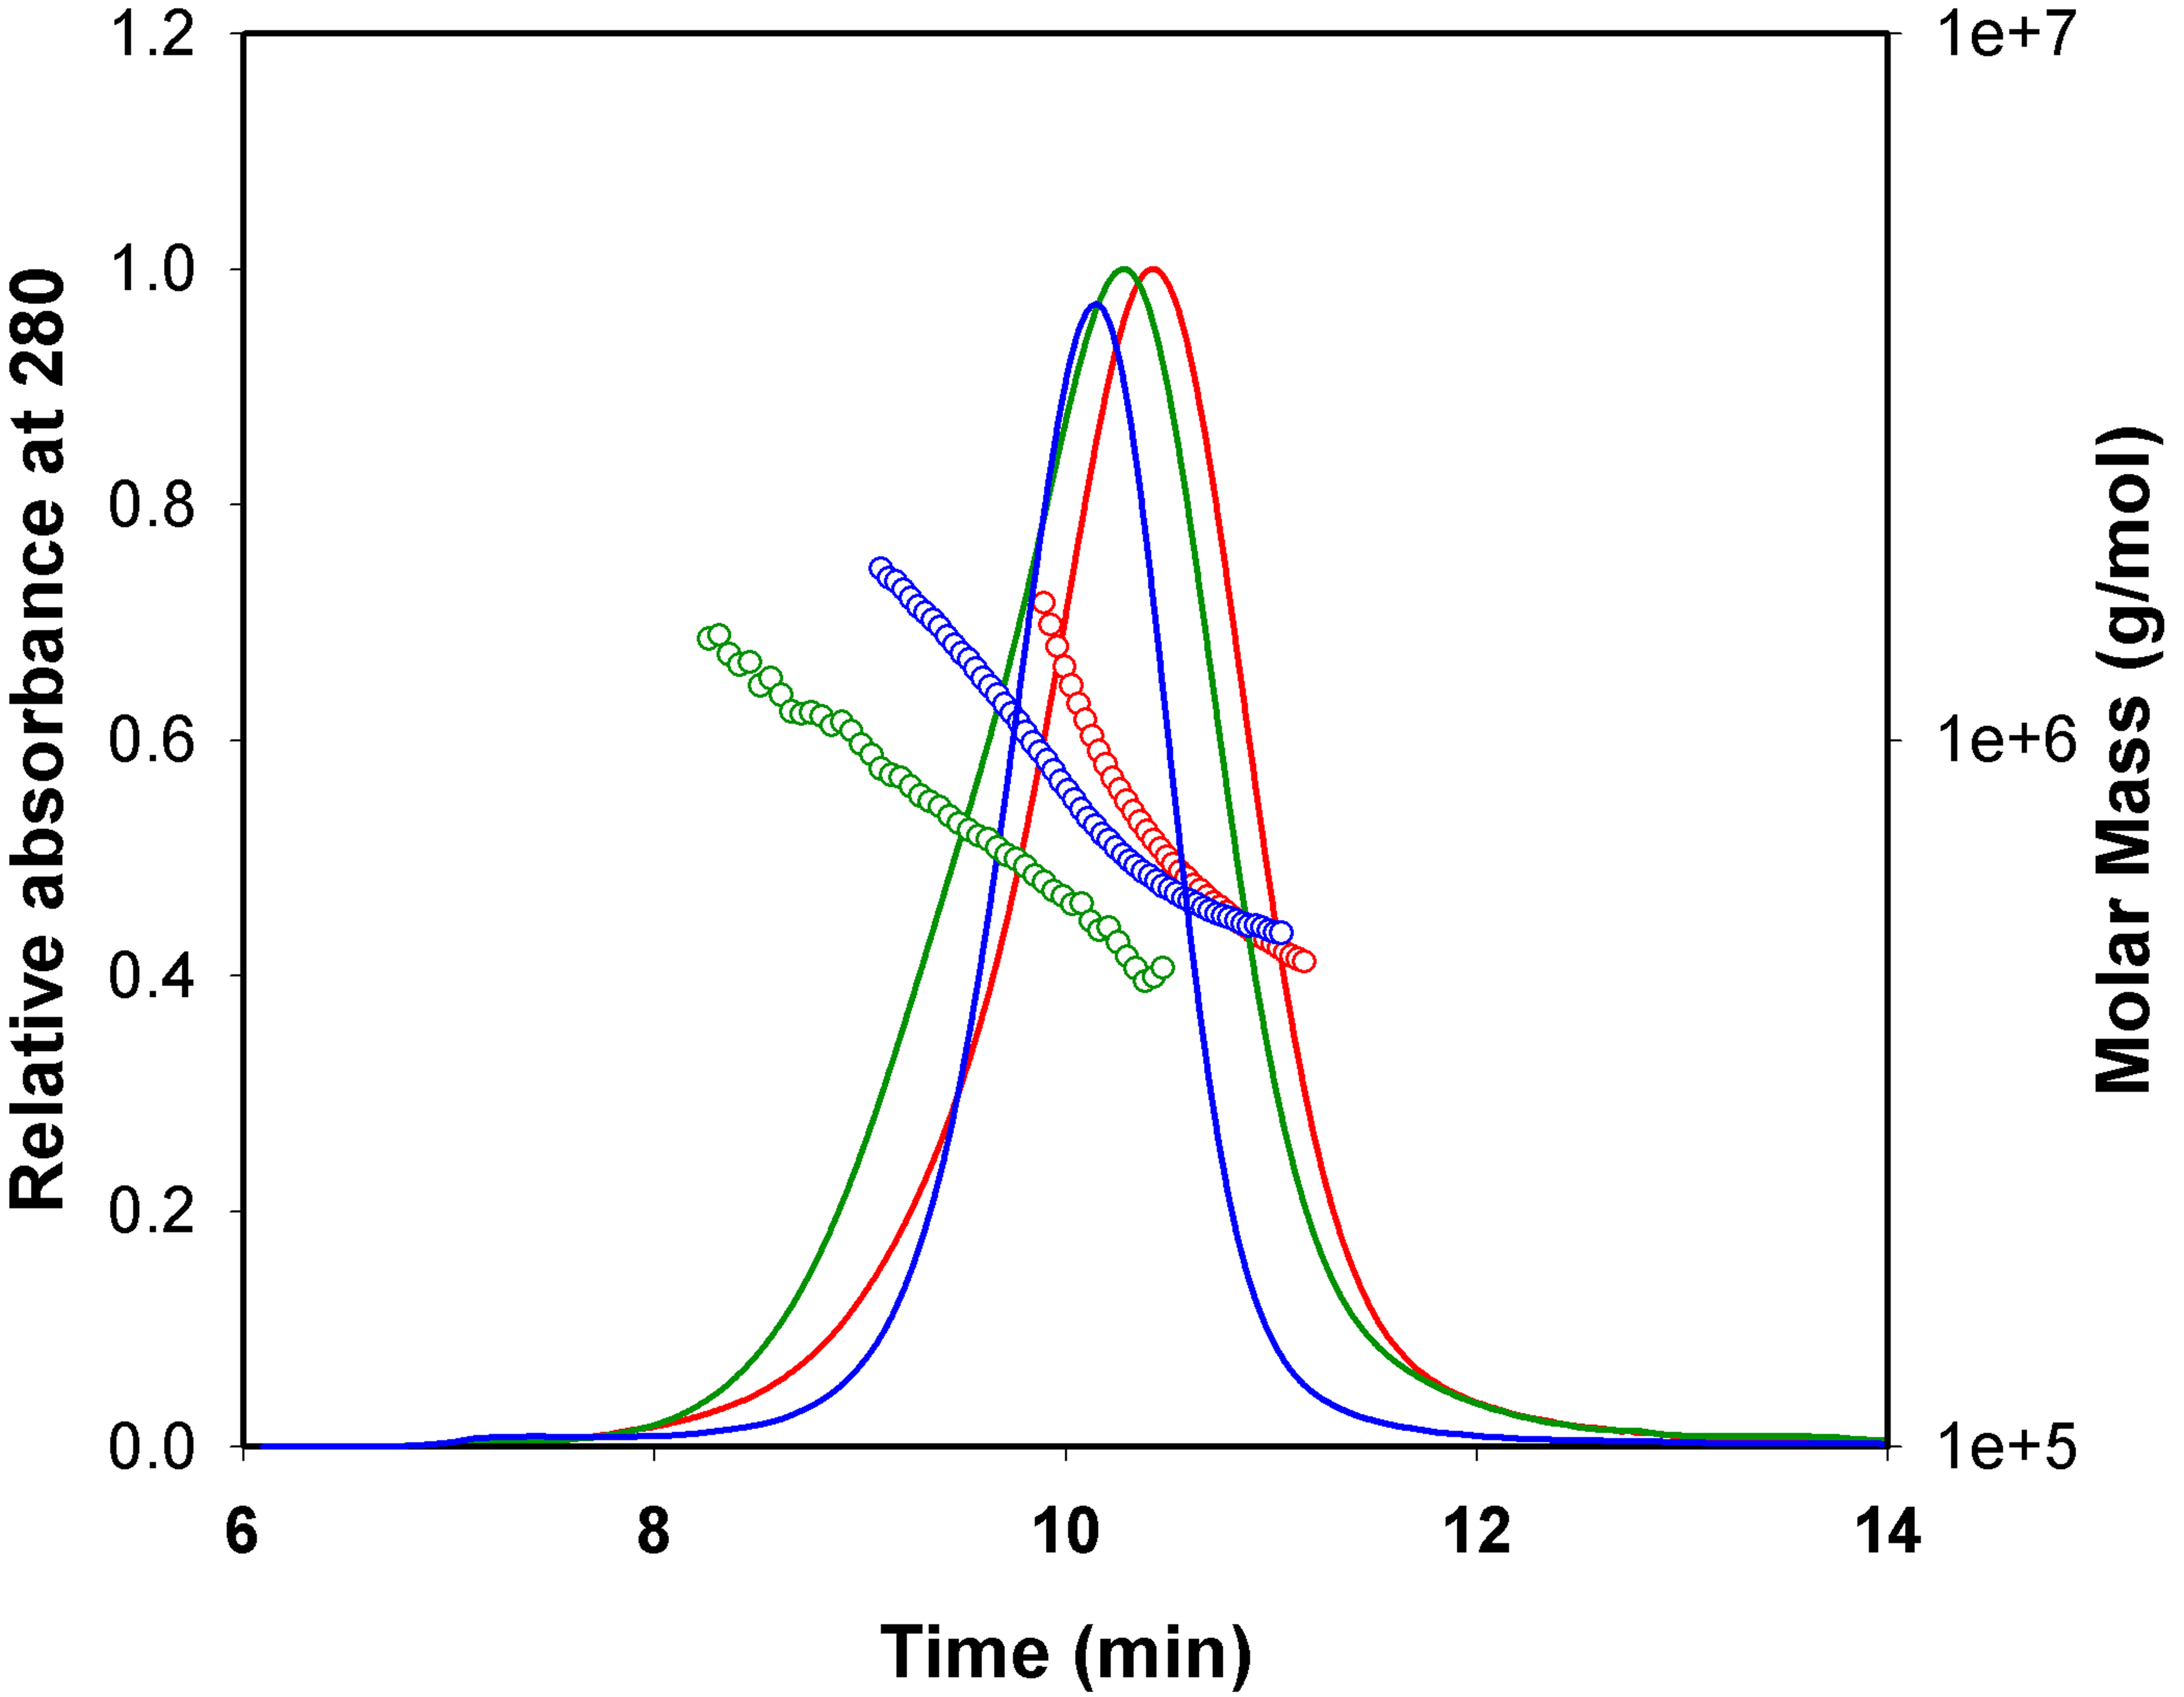
Figure 2. Molar mass distribution and
elution profile of mutant and wild-type αB-crystallin proteins under
reducing conditions. Protein (0.1 mg each) in buffer was injected into
a TSK5000 gel filtration column connected to a multi-angle light
scattering instrument, and the data was analyzed as described under
Methods. Blue, wild-type αB-crystallin; Green, αBI5C; Red, αBT162C.
Molecular mass of αBI5C and αBT162C mutants was not
significantly altered compared to that of wild-type αB-crystallin
under reducing conditions.