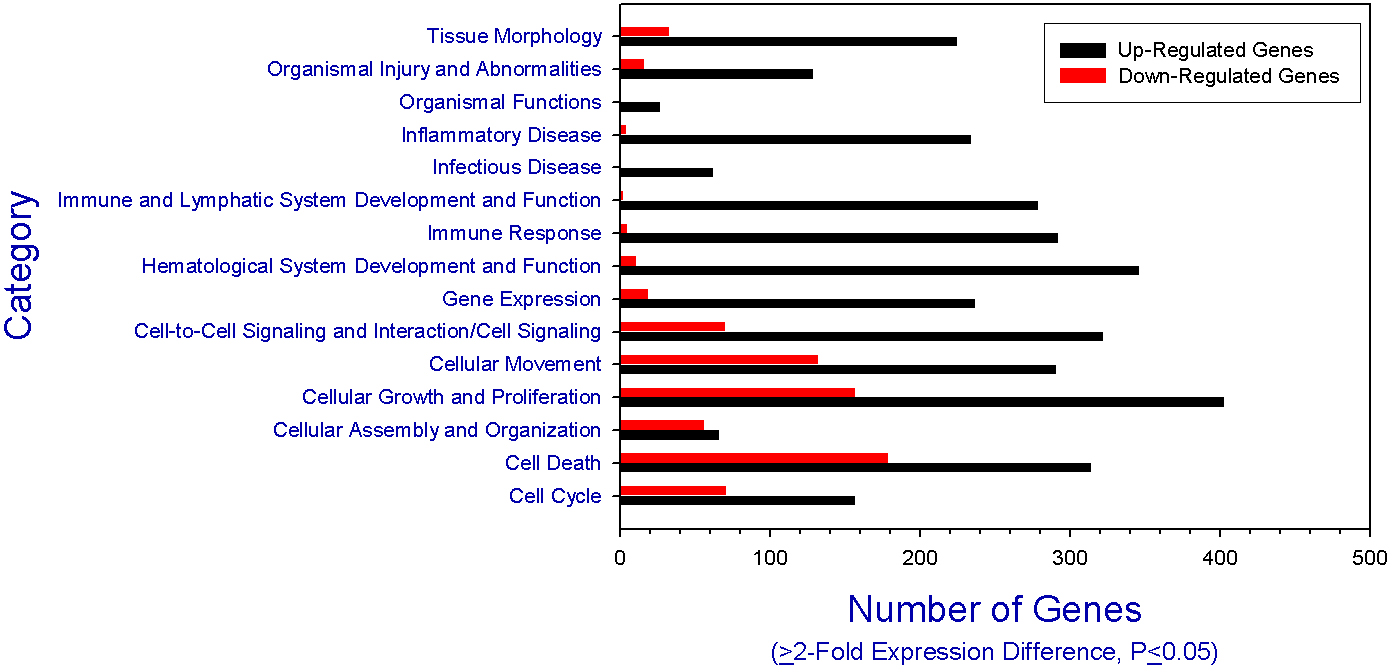
Figure 2. Differential upregulation and
down-regulation of corneal genes. Microarray results compare gene
expression levels in mouse corneas from Candida albicans-infected
compared to corneas from mock-infected controls. The results were
assigned to general categories based upon the known functions of the
gene products. The number of genes expressing a twofold or greater
significant difference (p≤0.05) is plotted for the listed categories.
Red bars represent the number of genes significantly down-regulated,
and black bars represent the number of genes significantly upregulated.