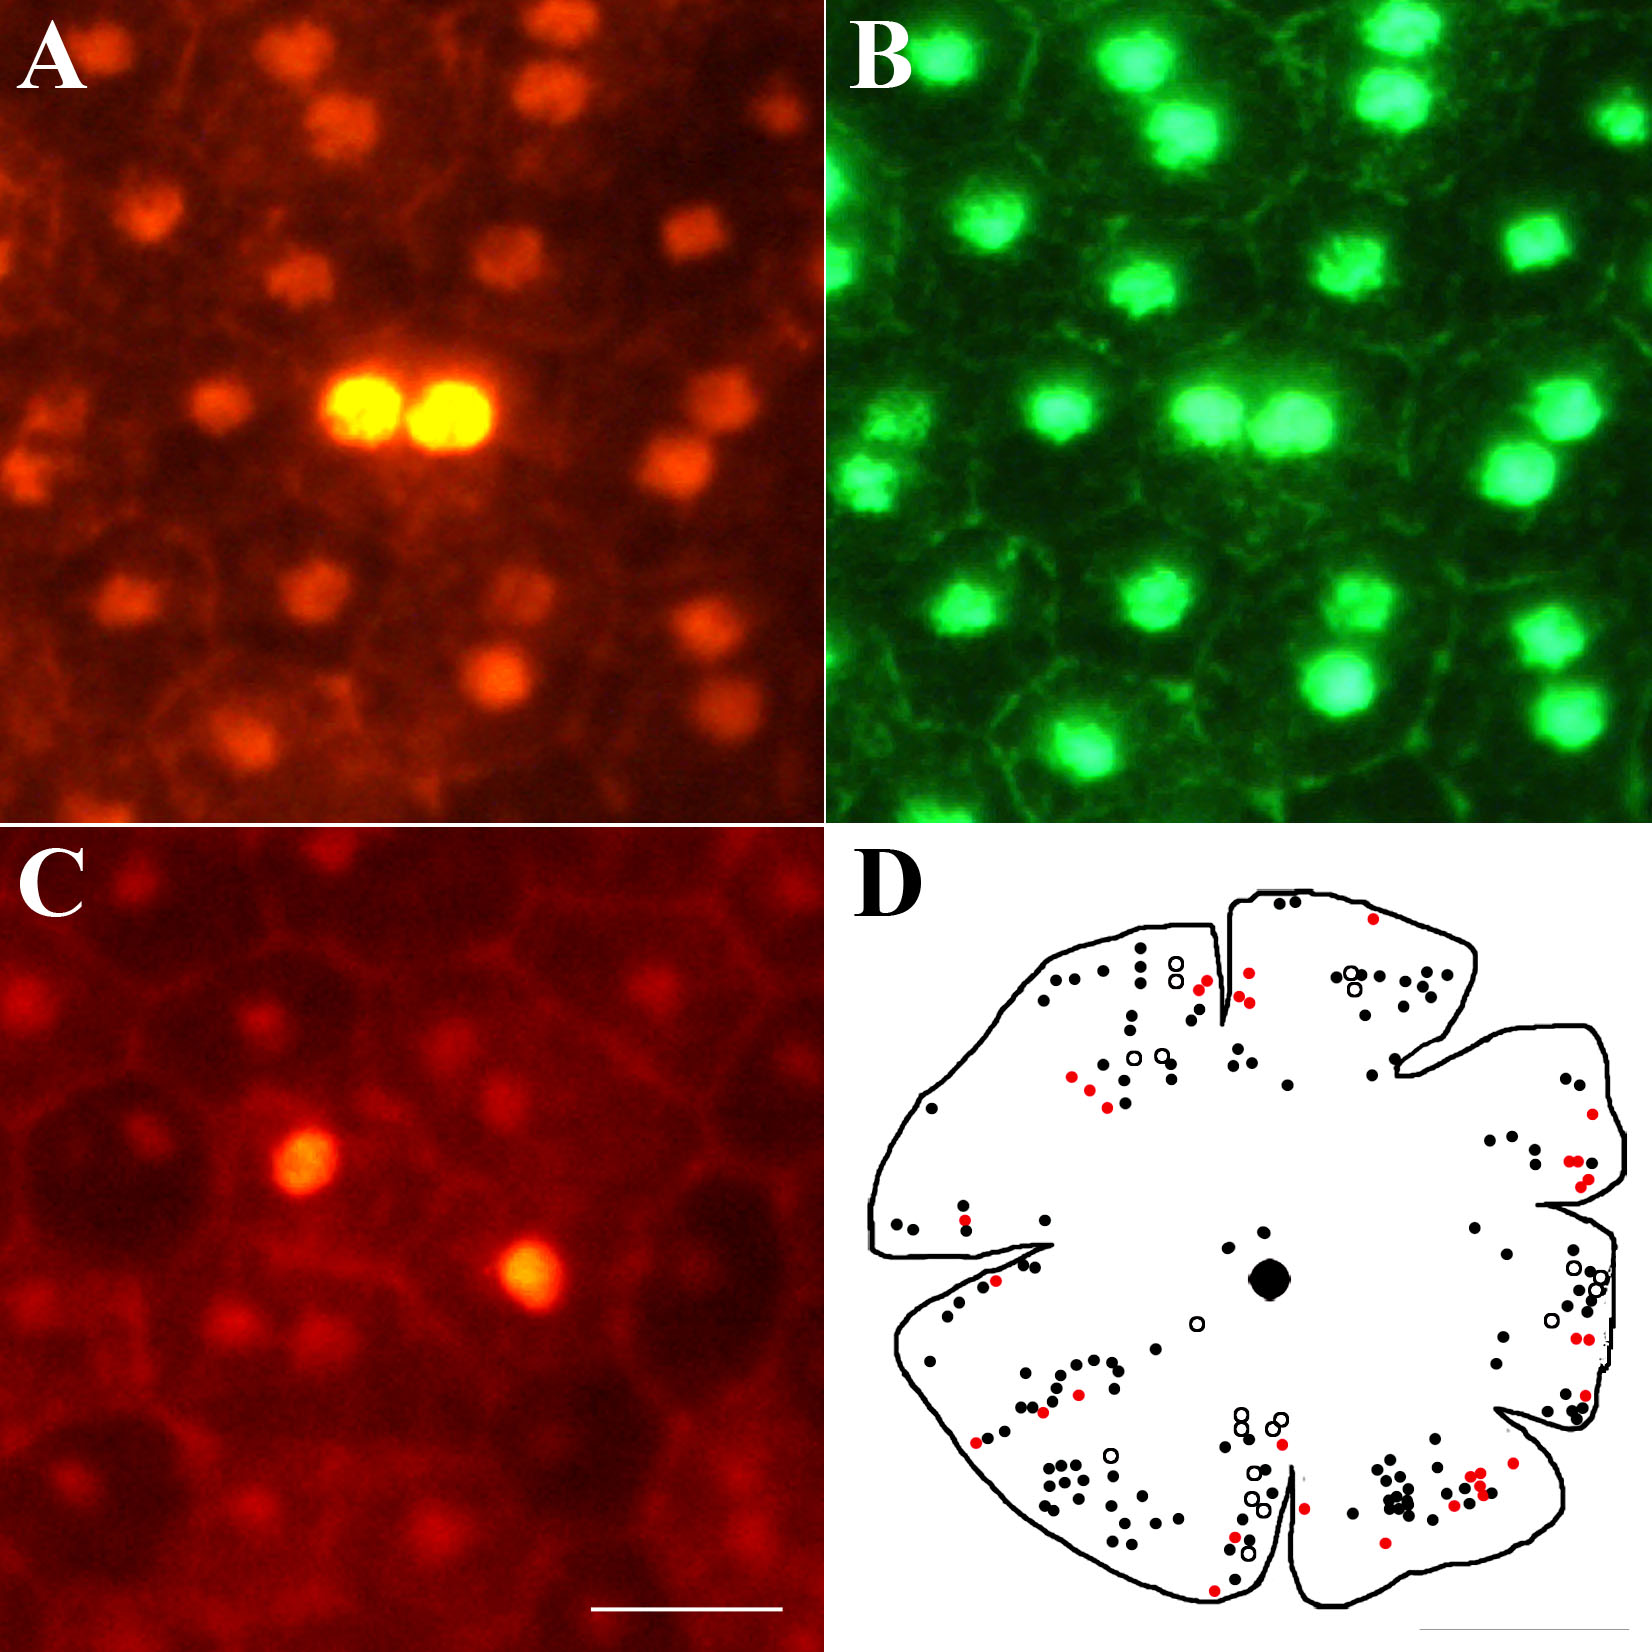
Figure 6. BrdU labeling in mature RPE
cells. A and B: Shows a binucleated labeled cell with
BrdU on red channel and Otx green channel. C shows two adjacent
mono-nucleated cells that are labeled with BrdU. Scale bar equals 20
µm. D shows an outline drawing on which the location of RPE
cells labeled with Ki67 and BrdU are marked. The diagram shows the
distribution of positive BrdU-labeled binucleated (black dots) and
mononucleated (black circle) cells. Only a small number of the
BrdU-labeled cells were more centrally located than those labeled for
Ki67. The mononucleated cells were almost always found in pairs of
close proximity. The red dots represent the number and distribution of
Ki67 positive RPE cells. While these largely overlap with the BrdU
labeled population of RPE cells, they tend to occupy a slightly more
peripheral location. The scale bar represents 2.5 mm.