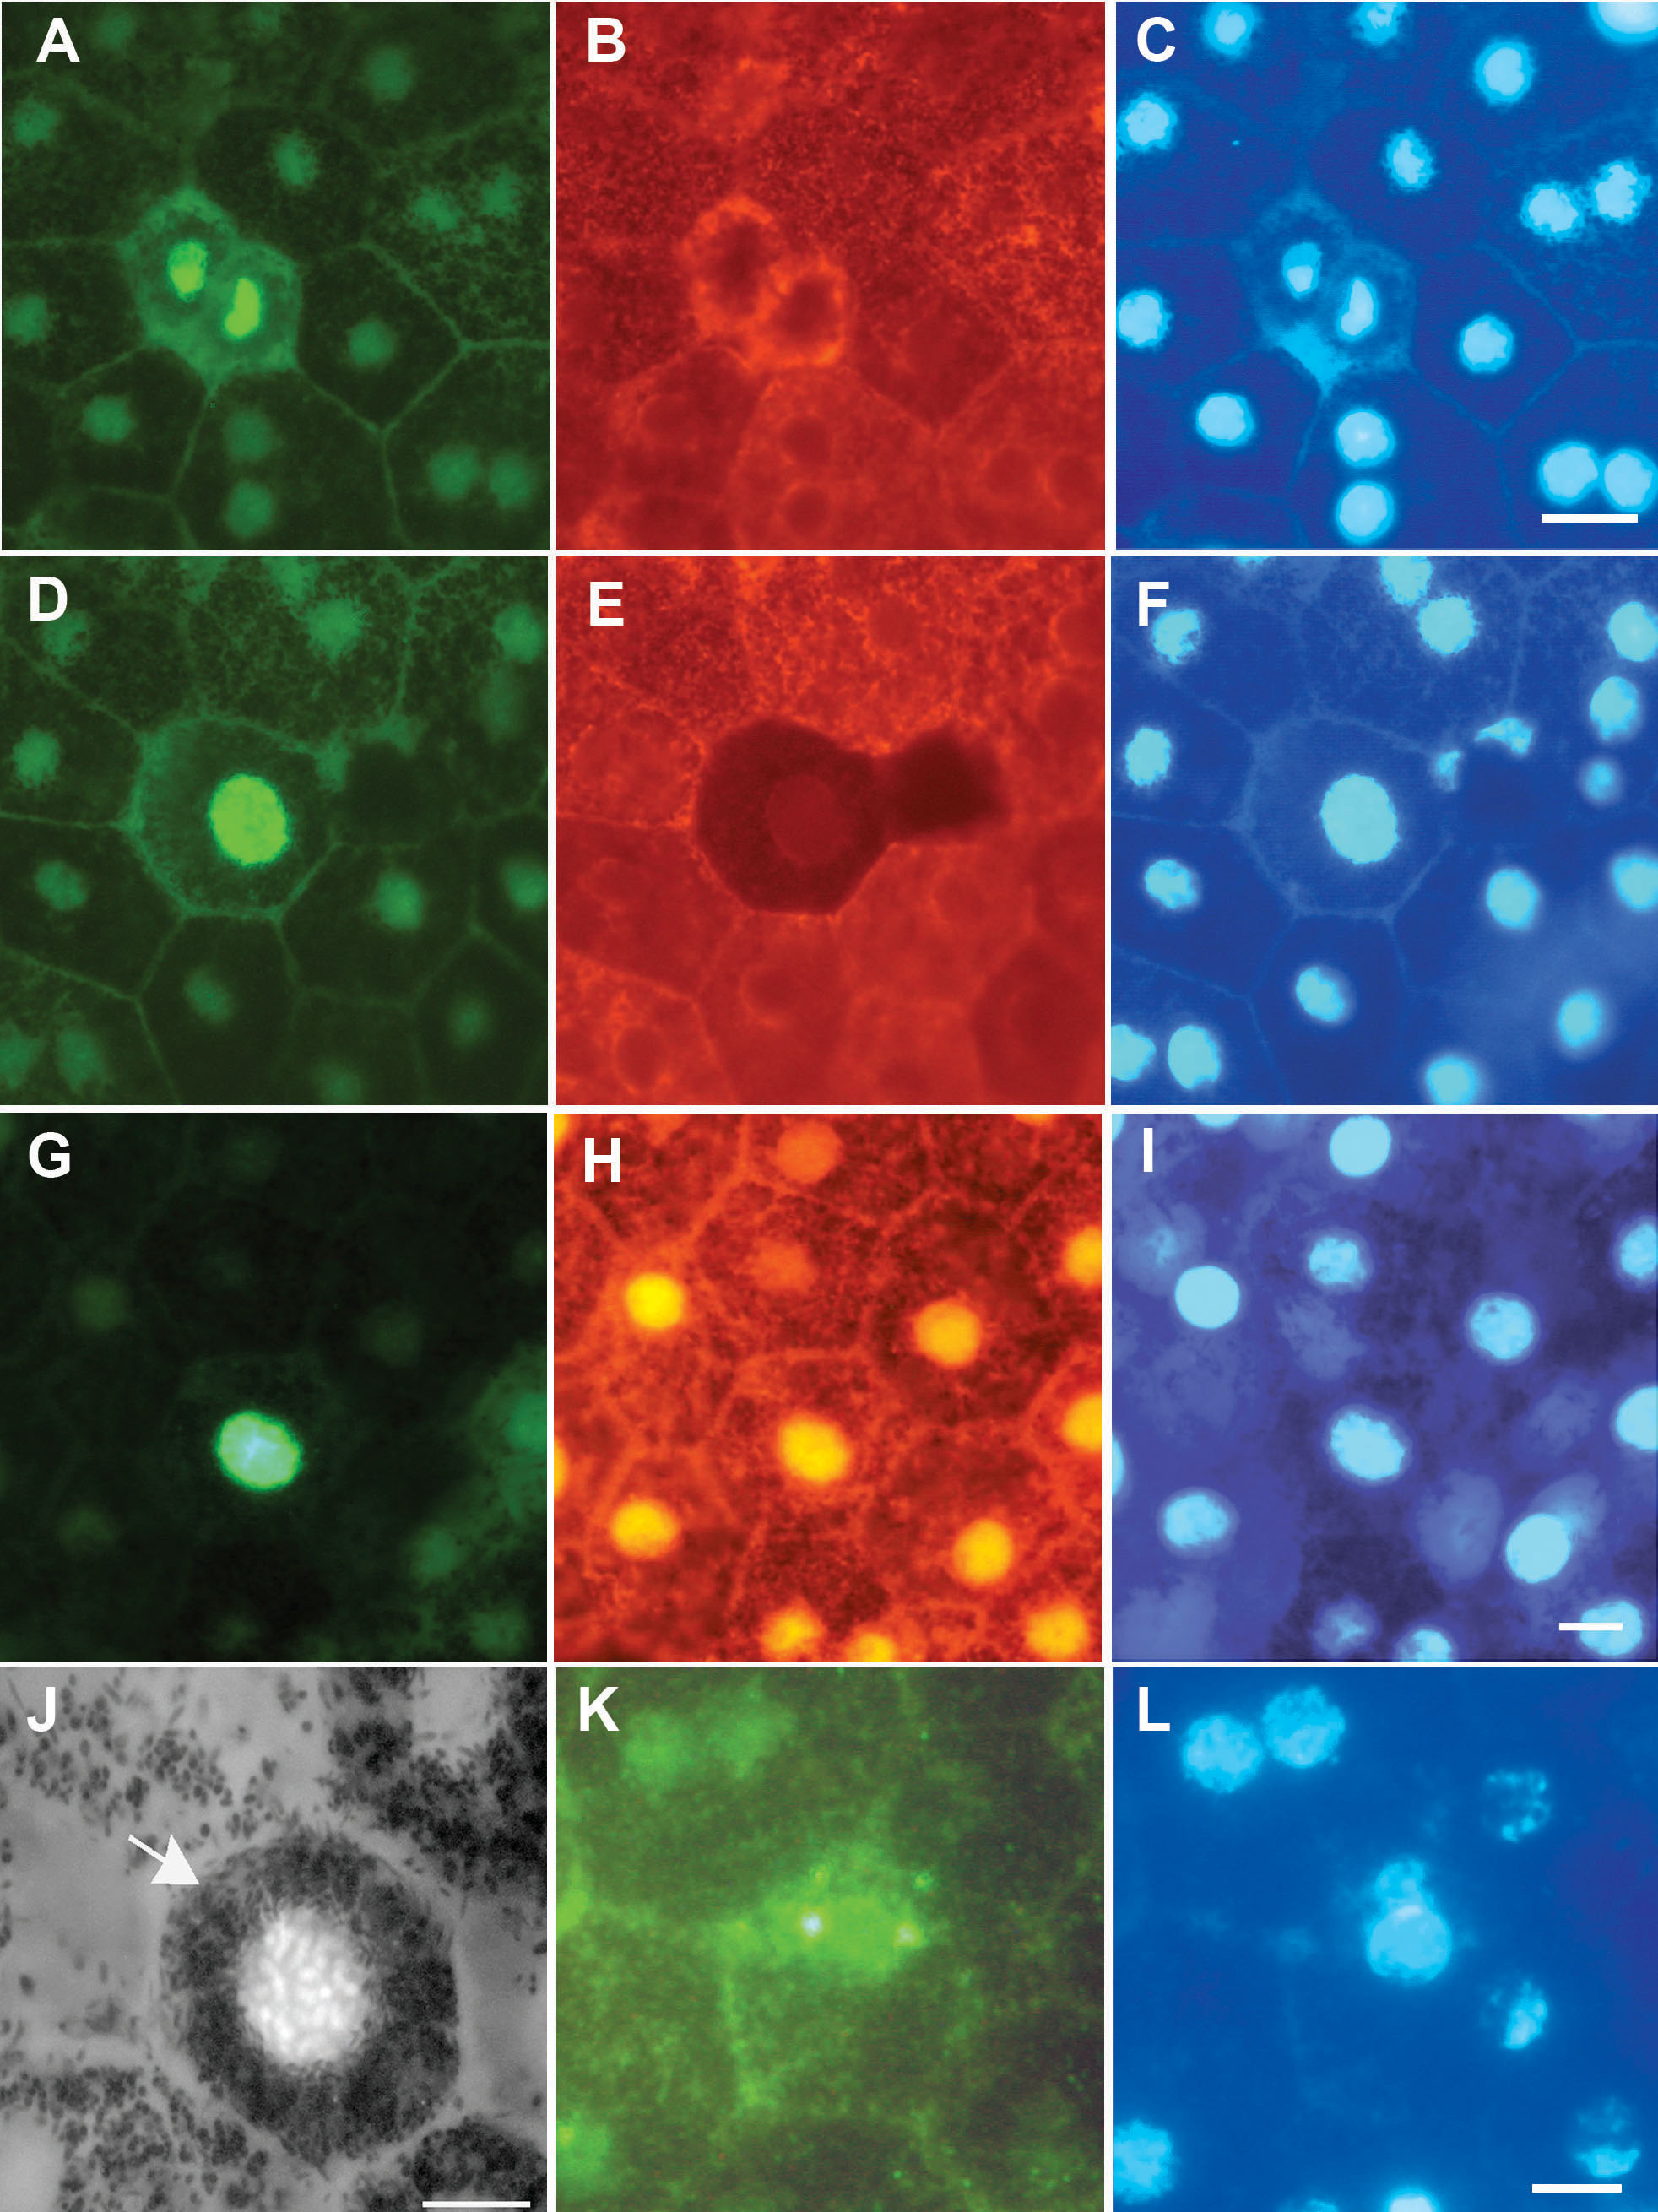
Figure 1. Labeling patterns in retinal
pigment epithelium (RPE) sheets in whole mount preparations taken from
DA rats. A: RPE cells positively labeled for Ki67. These appear
to be in anaphase. B: This is the same region as shown in A,
but stained with RPE65, which is an RPE specific marker in this tissue.
C: This is the same region as shown in A and B
but stained with DAPI to reveal the nuclei of the imaged cells. D-F:
These are stained in the same way as A-C, however here the cell
positive for Ki67 shown in D has down-regulated RPE65 as shown
in E. F is the corresponding DAPI stained image. G:
This shows a Ki67 positive RPE cell which has also in H
been stained with CRALBP, which is a second RPE specific marker in this
tissue. I is the same region stained with DAPI to reveal
nuclei. J shows a Ki67 positive RPE cells. Taken in black and
white the melanin granules in the cell can be clearly identified
(arrow), which along with the RPE65 and CRALBP confirm that the tissue
sheet examined is RPE. K shows an RPE cell positive for a
second cell cell cycle marker PCNA, and L shows the same image
stained with DAPI. The scale bar represents 10 µm.