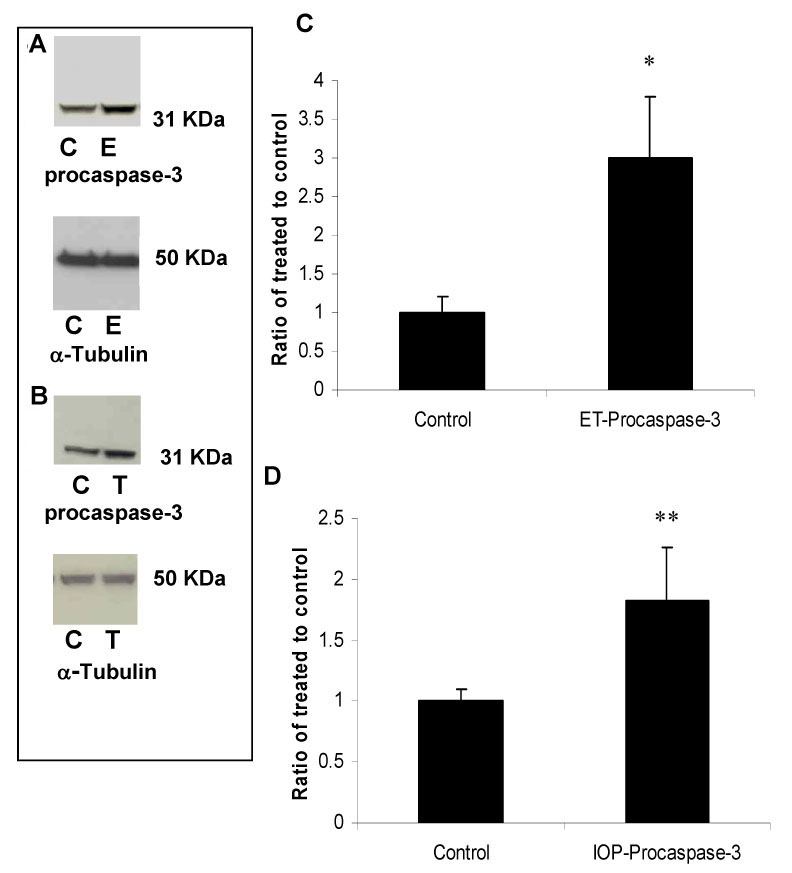
Figure 5. Procaspase-3 protein is
upregulated following intravitreal ET-1 injection and elevation of
intraocular pressure. Procaspase-3 (31 kDa) is normally cleaved to a 17
kDa fragment that is fully active. However, in both models, an
upregulation of the procaspase-3 form was observed without detection of
the 17 KDa fragment. A: Immunoreactive bands for procaspase-3
and α-tubulin 2 days after intravitreal injection of ET-1 showing a
significant increase in procaspase-3 protein levels (300%). B:
Quantitative measurement using western blot also showed that elevation
of IOP increased procaspase-3 protein levels by ~ 180%. Isolated
cytosolic proteins (50 μg) were loaded into each lane. Densitometric
quantification is shown in figures C and D. Data are
expressed as a ratio of the control value and each column represents
mean±SEM. The asterisk denotes statistical significance of procaspase-3
in ET-injected retinas versus control (p<0.05) and the double
asterisk denotes statistical significance of procaspase-3 in elevated
IOP-retinas versus control (p<0.05), as determined by one-way ANOVA
and Tukey multiple comparison test. Abbreviations: control eye (C),
ET-injected eye (E), and elevated IOP (T).