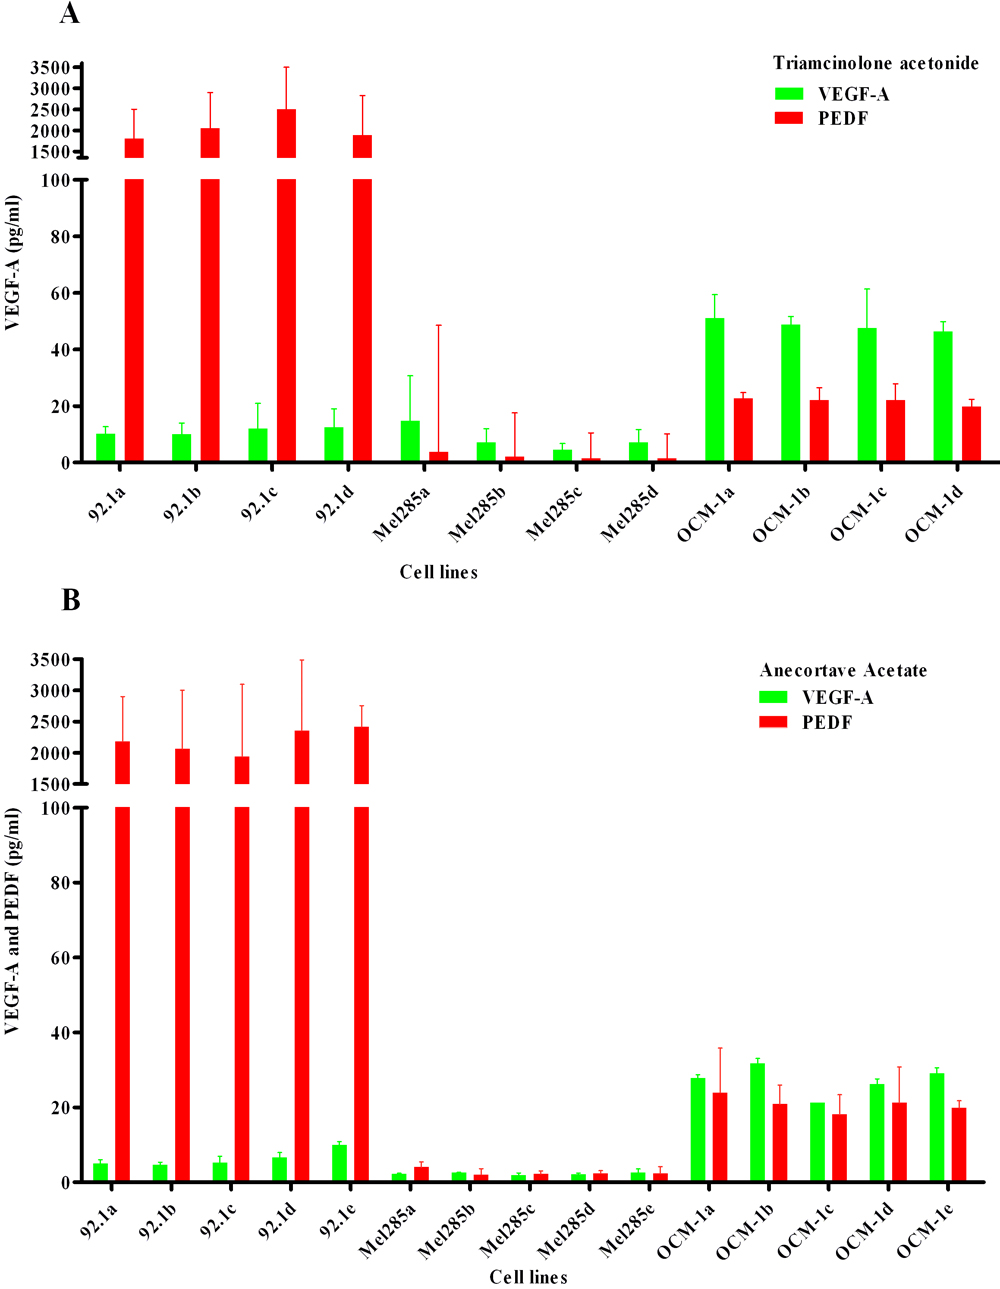
Figure 2. Production of VEGF-A and PEDF in
three different UM cell lines exposed to various TA and AA doses. Cells
were treated with four or five different suspensions. A: For
tr161516iamcinolone acetonide (TA) experiments, we used either Park
Memorial Institute/Dulbecco’s Modified Eagle Medium (RPMI/DMEM;
control; a), RPMI/DMEM with methanol (second control;b), a 10 μM
TA suspension (c), or a 100 μM TA suspension (d);
B: For anecortave acetate (AA) experiments, we used either RPMI
(control; a), RPMI with dimethyl sulfoxide (DMSO; second control; b),
0.1 μM AL-4940 solution (c), 1.0 μM AL-4940 solution (d),
or 10 μM AL-4940 solution (e). The level of vascular
endothelial growth factor-A (VEGF-A) protein (n=2) is shown in pg/ml
(mean±SD). All cell lines produced VEGF-A and pigment
epithelium-derived factor (PEDF), but clear differences were observed:
OCM-1 produced the highest levels of VEGF-A, while cell line Mel 285
produced the lowest amount of VEGF-A. Cell line 92–1 produced large
amounts of PEDF (>2000 pg/ml). Mel 285 produced scant PEDF. Addition
of TA or AA to the cell cultures had no effect on either VEGF-A or PEDF
production.