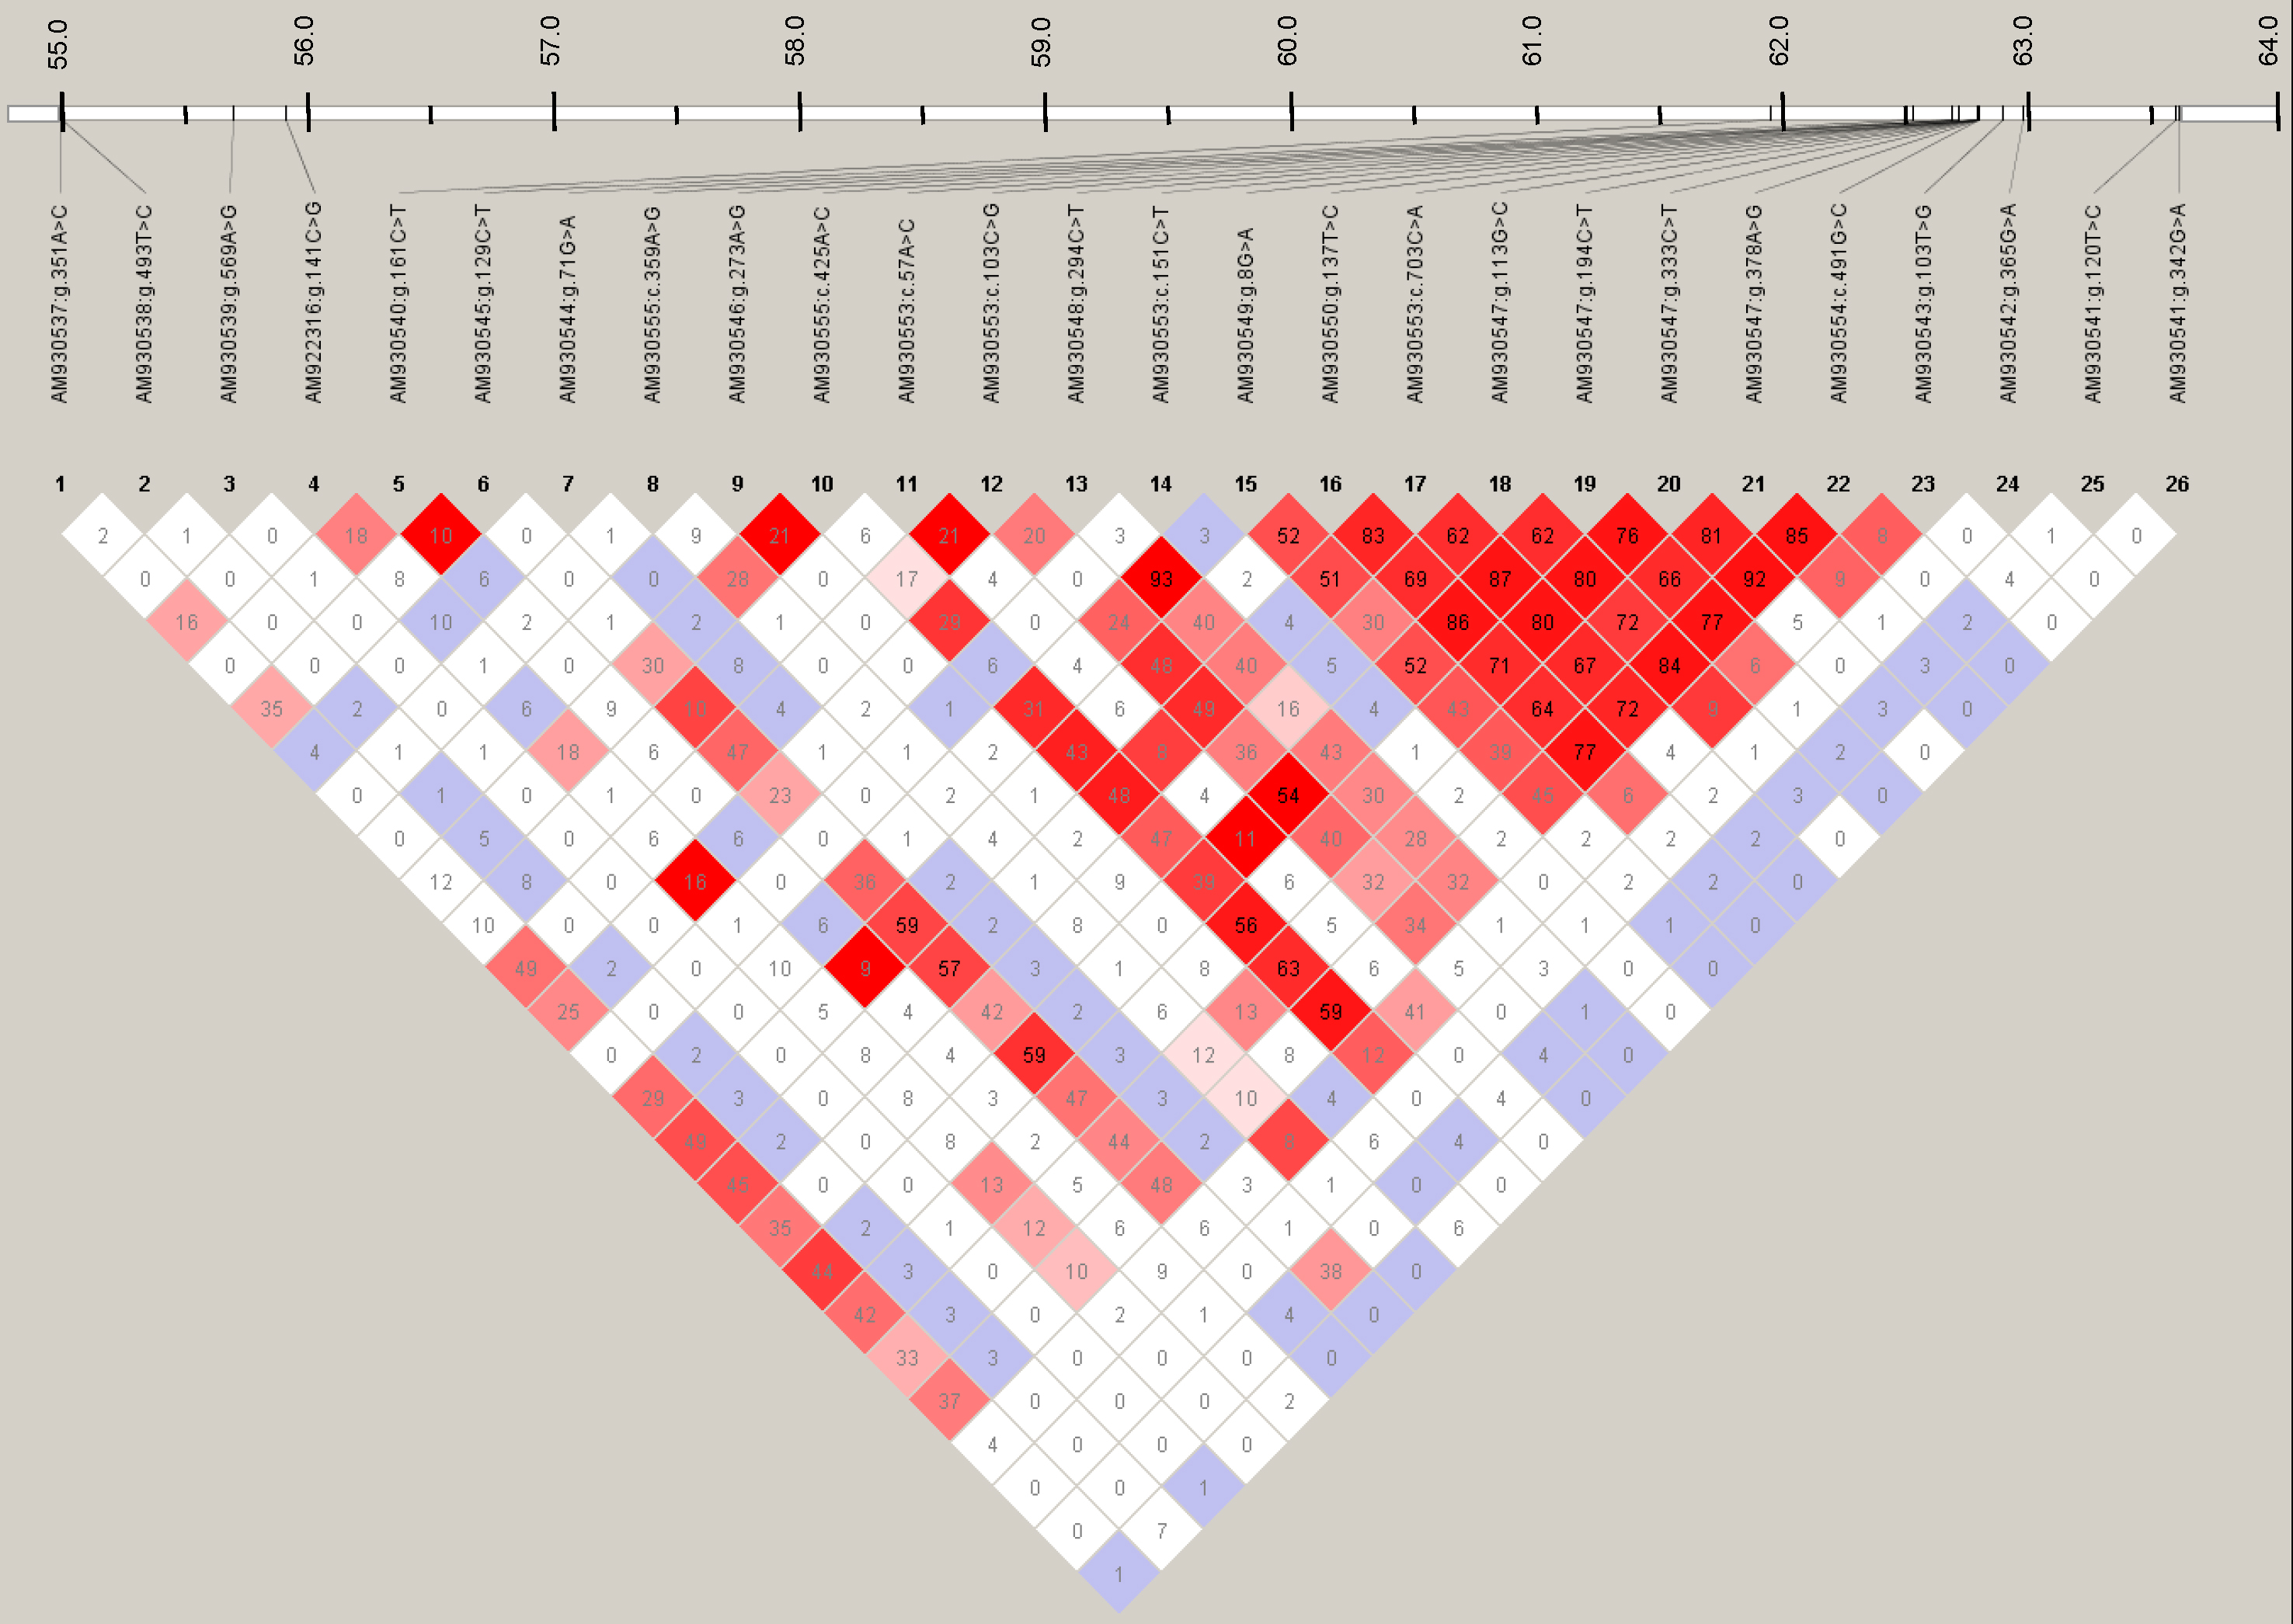
Figure 5. Linkage disequilibria and
positions of the single nucleotide polymorphisms on the telomeric end
of BTA18. LD coefficients (r2) between the SNP pairs are
indicated, and the position on BTA18 is pictured. Red fields with black
font display r2 values greater than 0.50. White and lilac
fields display r2 values less than 0.15.