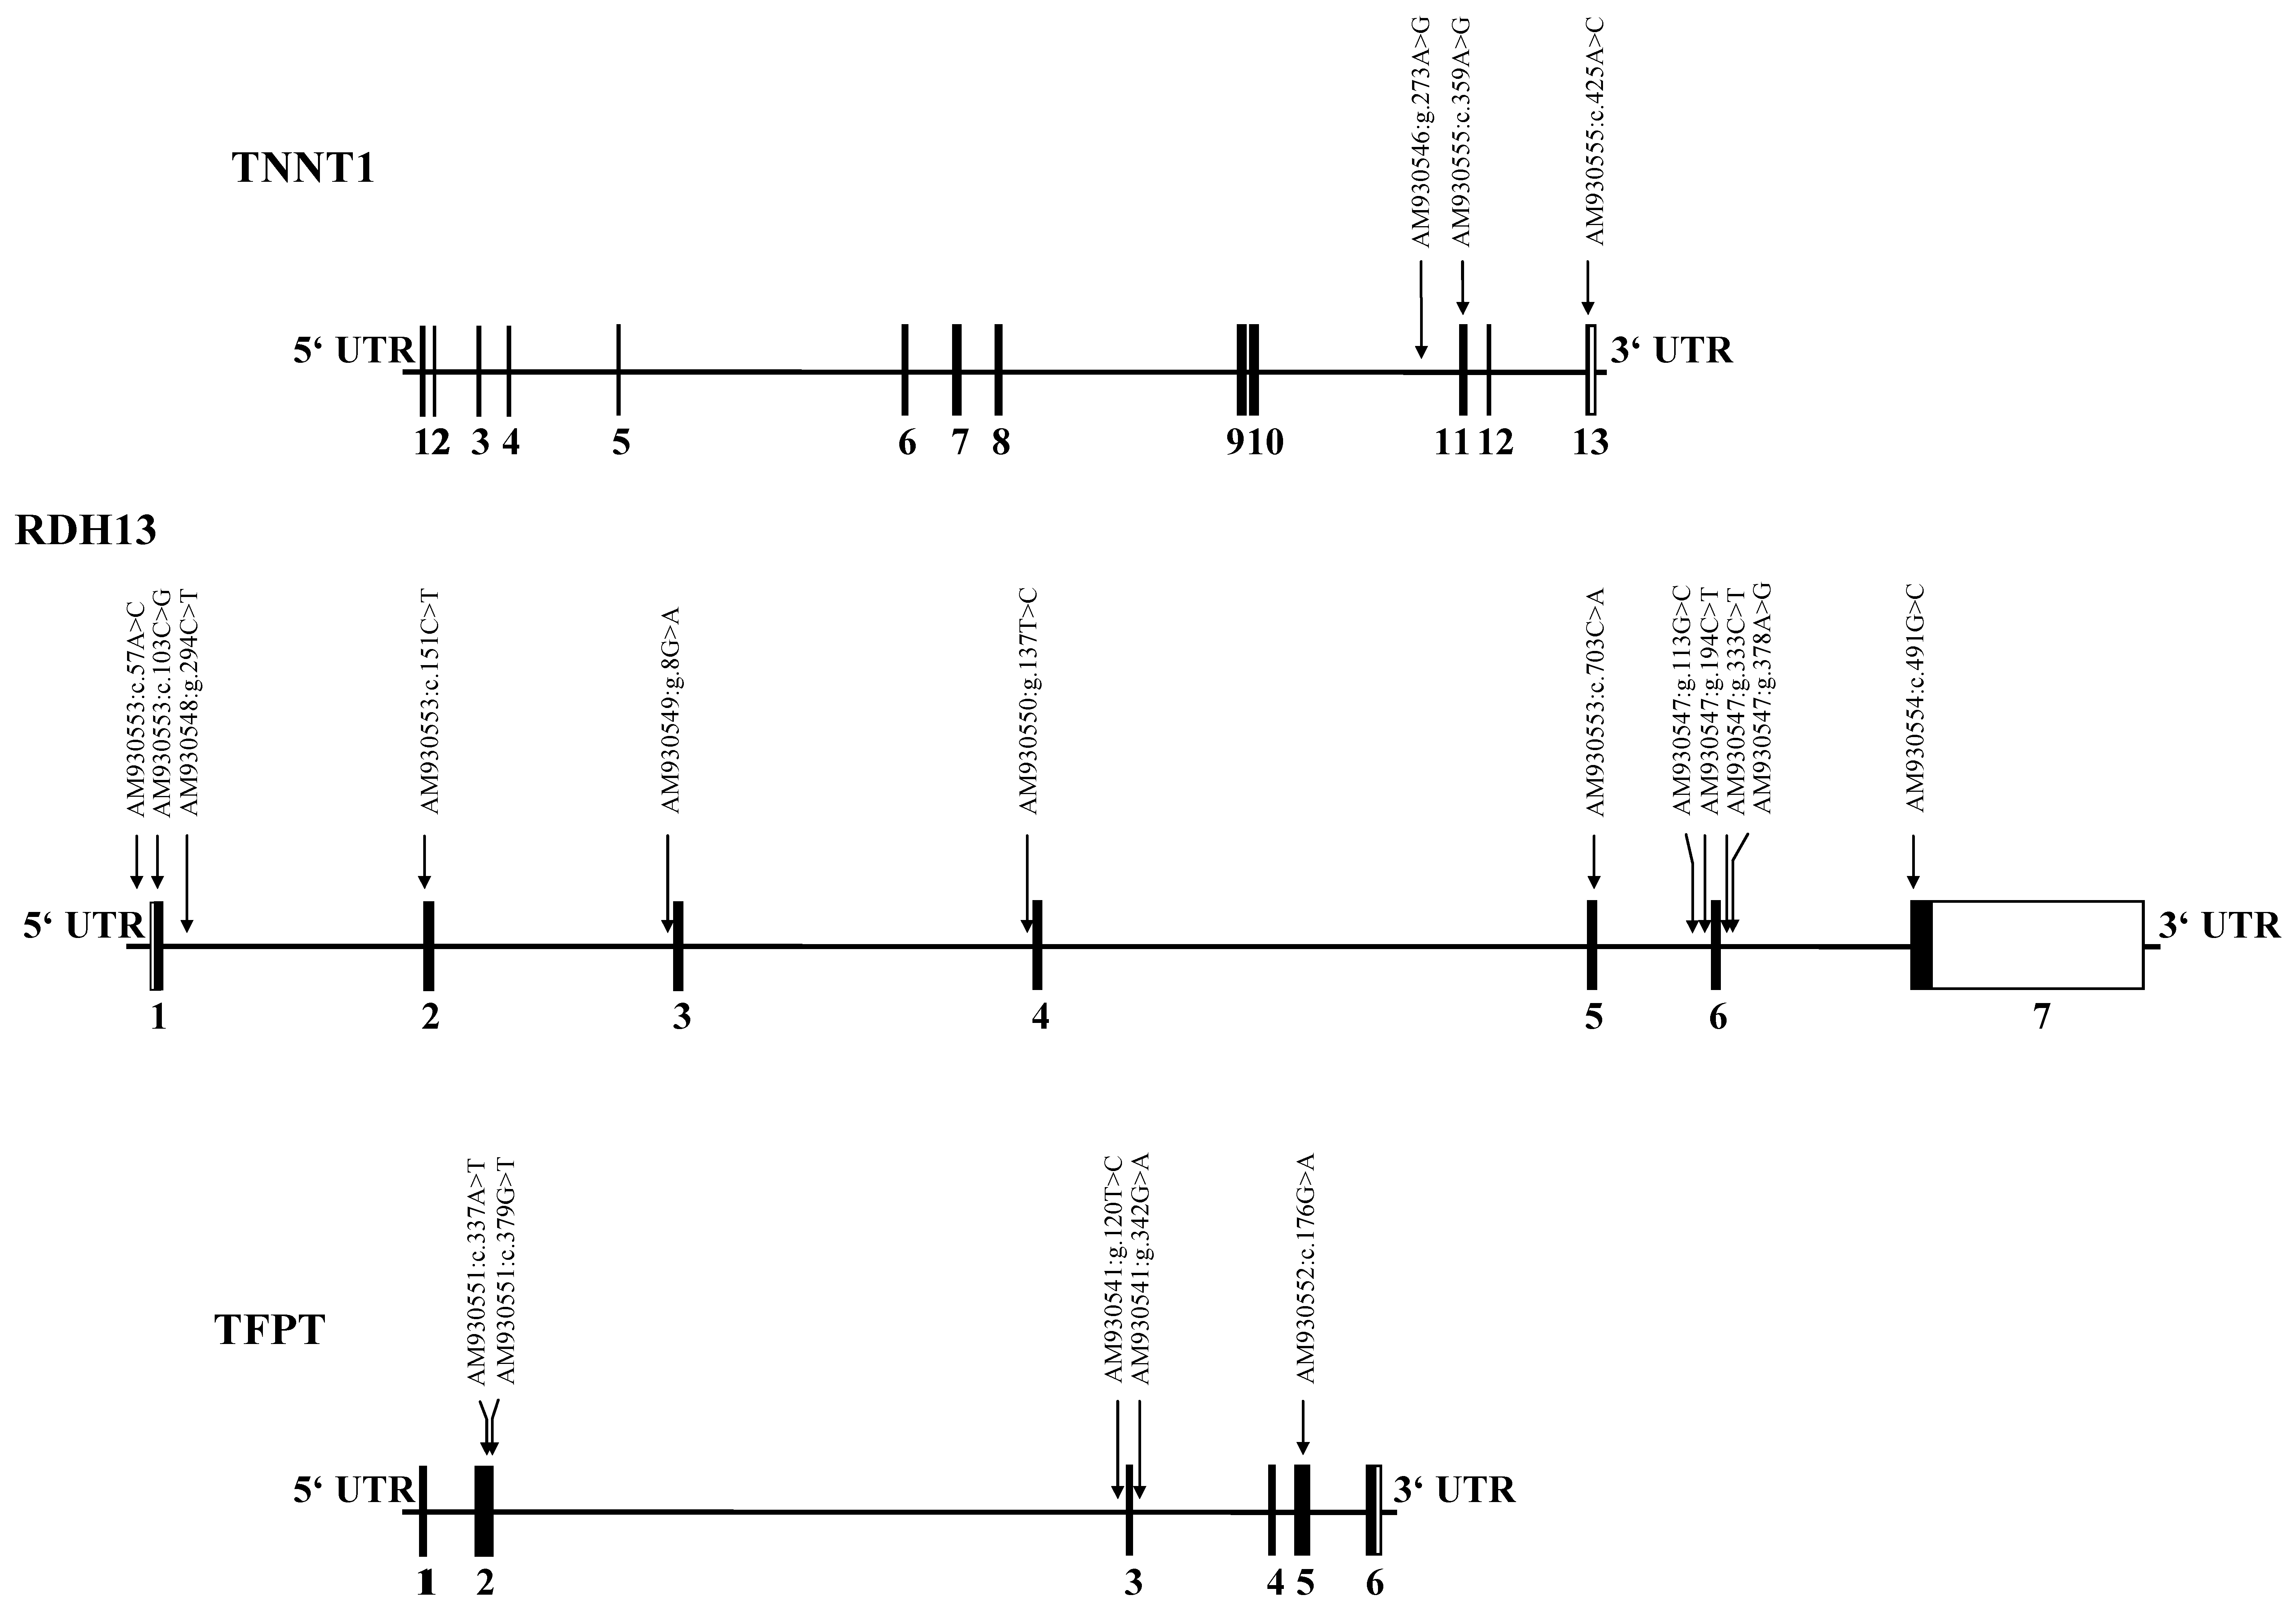
Figure 3. Gene structure and detected
single nucleotide polymorphisms within the candidate genes. The gene
structure and the detected SNPs within TNNT1 (9,366 bp), RDH13
(16,985 bp), and TFPT (7,644 bp) are shown. The positions of
the SNPs are indicated by arrows. Translated exons are shown as solid
boxes and numbered with Arabic numerals. Untranslated regions of exons
are shown as open boxes.