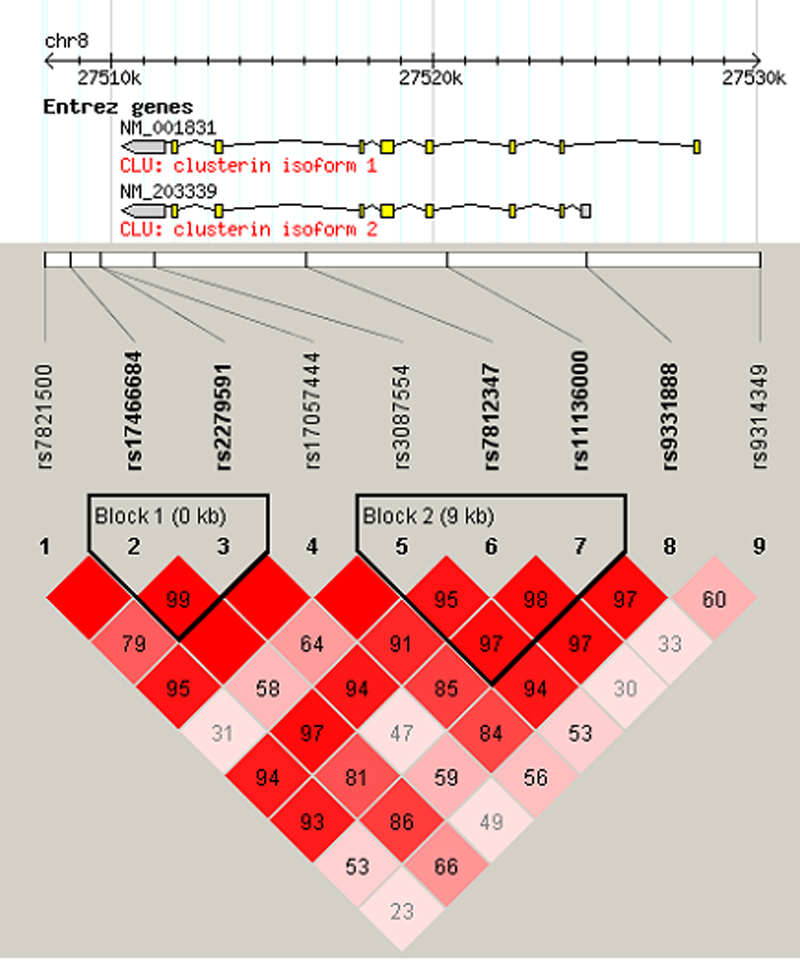
Figure 2. Gene schematic and linkage
disequilibrium of genotyped SNPs. The gene schematic is taken from
HapMap. Exons are displayed as boxes
and introns as connecting lines, and untranslated regions are shaded
gray. Linkage disequilibrium structure across
CLU calculated in
Haploview is
shown. D′ values are given in the cell intersecting for each pair of
SNPs. A blank cell indicates D′=1.0. The darker the cell, the greater
the linkage disequilibrium between the SNPs. Haplotype blocks are
outlined and were defined using the confidence interval method of
Gabriel et al. [
29].