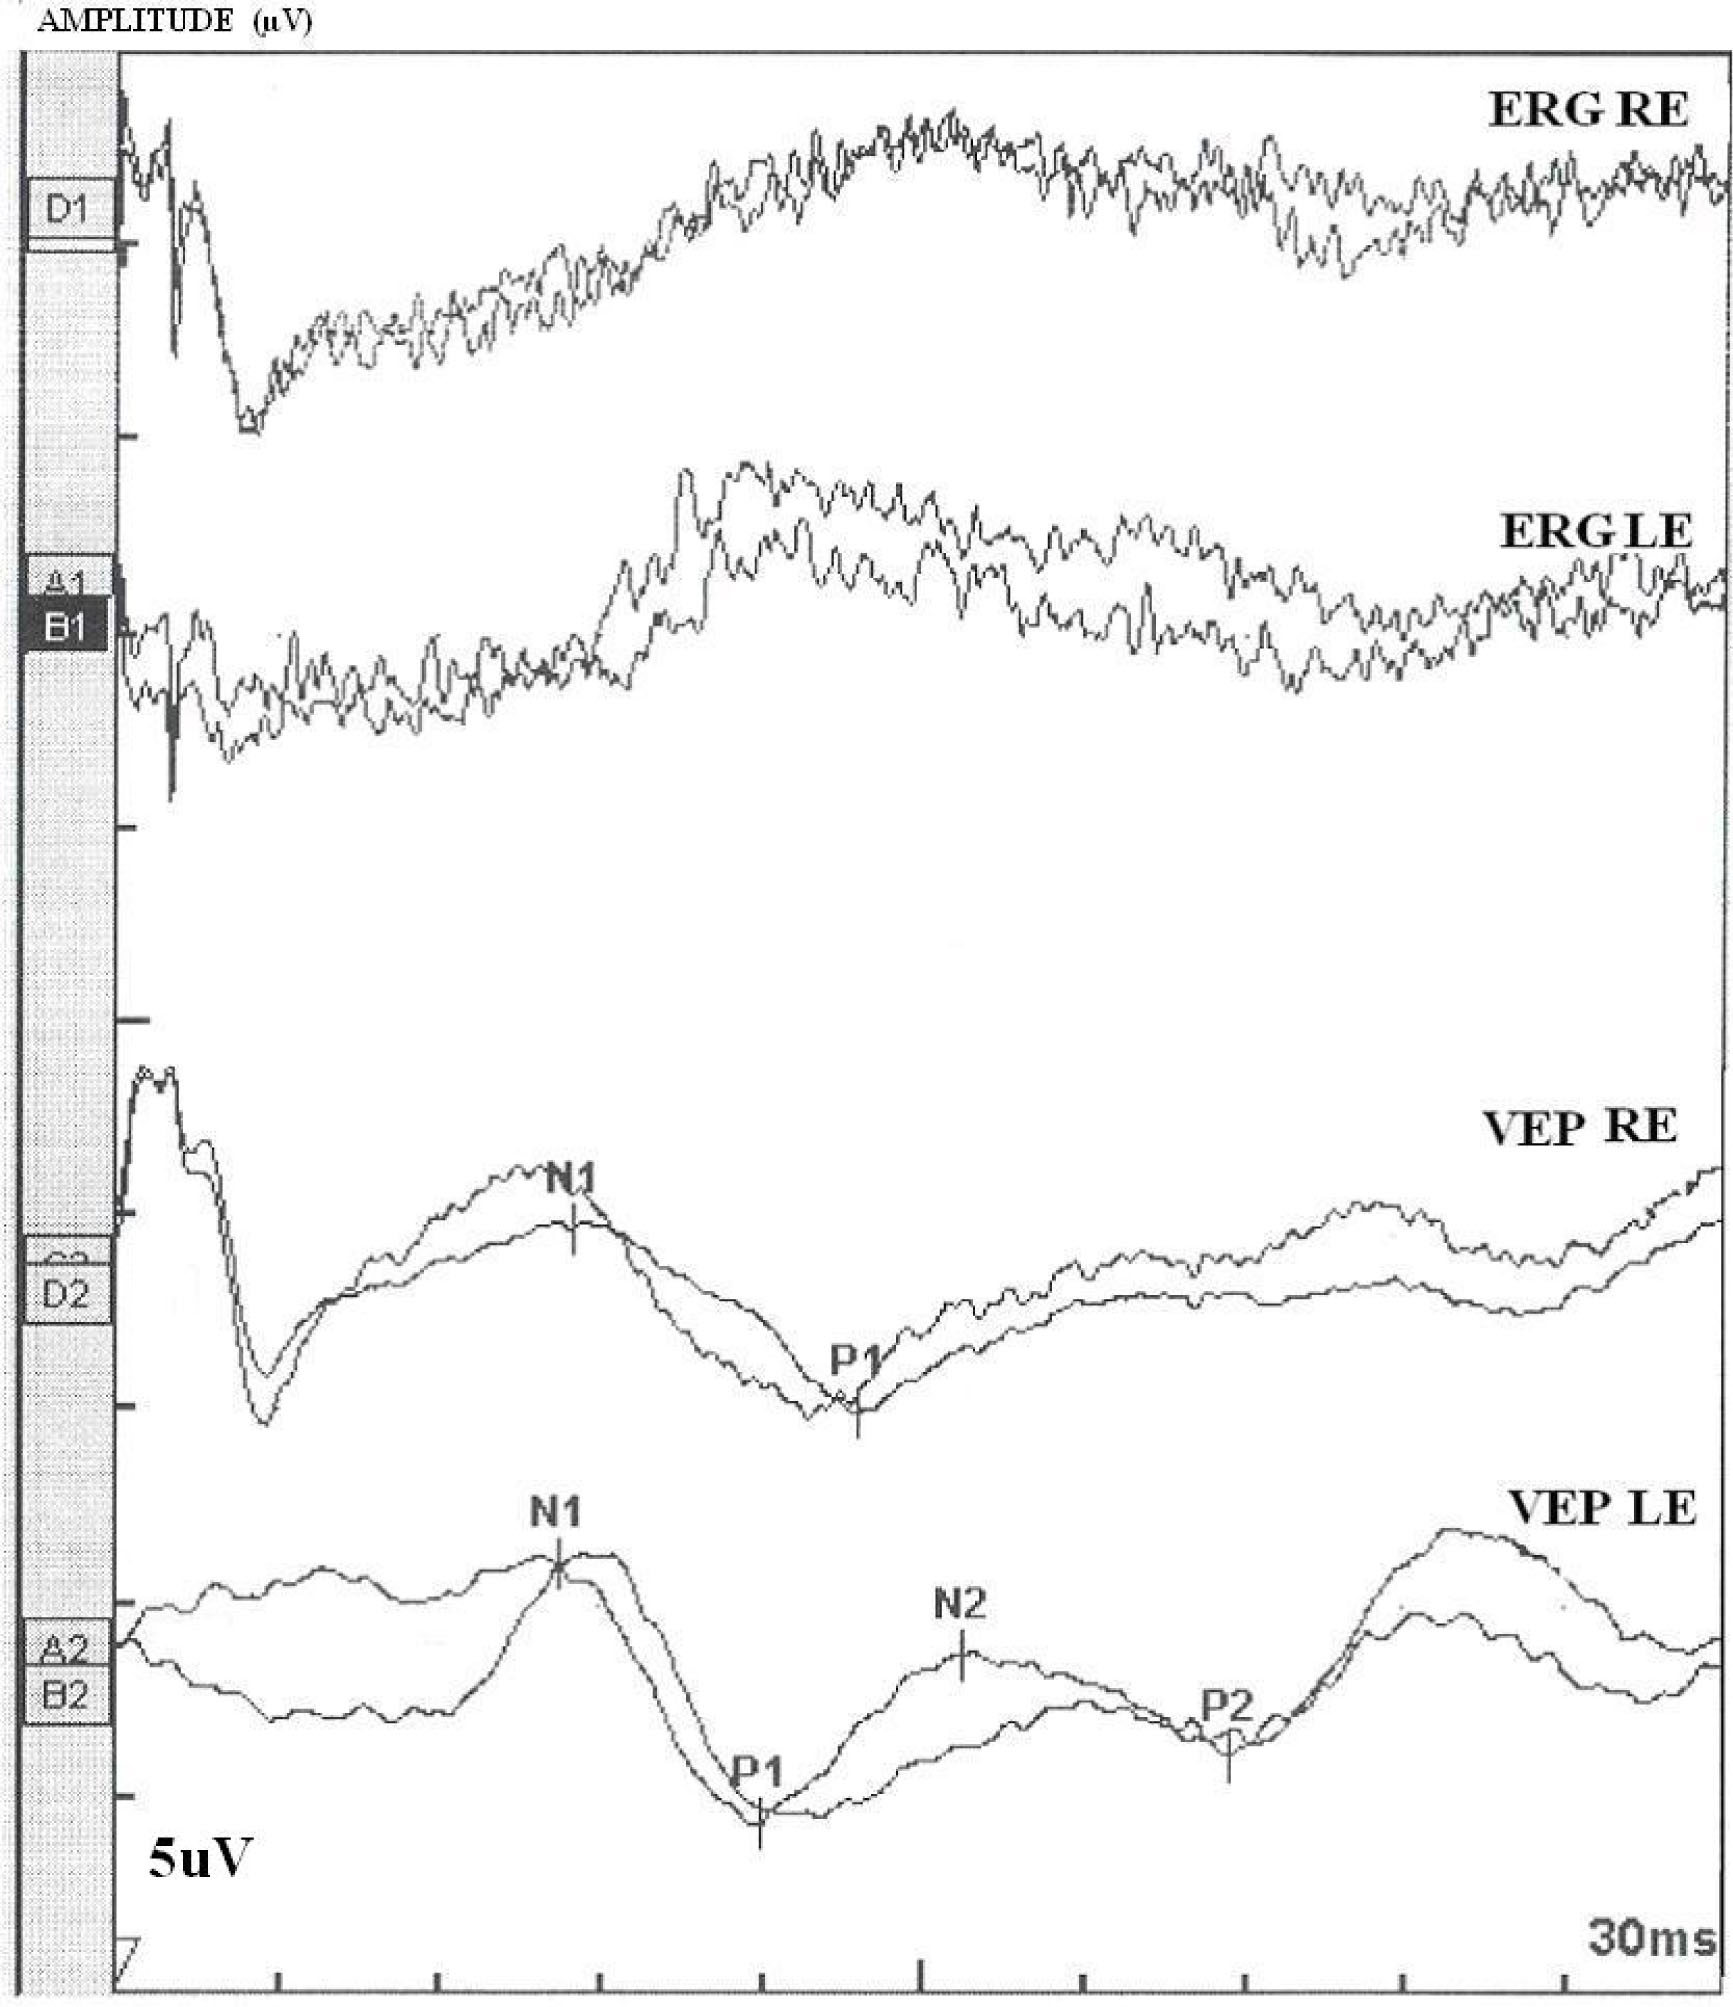
Figure 4. Ganzfeld-Electroretinogram of
the right and left eyes of the patient BT189. The following
abbreviations were used: Left eye (LE), right eye (RE),
electroretinogram (ERG), visual-evoked potentials (VEP), positive peak
(P1 and P2), negative peak (N1 and N2). The ERG and the VEP tests the
function of the visual pathway from the retina (ERG) to the occipital
cortex (VEP). These tests were conducted by placing a standard ERG
device attached to the skin on 2 mm above the orbit. VEPs were recorded
simultaneously from electrode attached to the occipital scalp 2 mm
above the region on the midsaggital plane. An electrode placed on the
fore head provided a ground. The results can be directly related to the
part of a visual field that might be defective. This is based on the
anatomical relationship of the retinal images and the visual field.
After dark adaptation for 30 min, the doctor will place anesthetic
drops in the patient's eye and place a contact lens on the surface of
the eye. Once the contact lens is in place, a series of blue, red and
white lights will be shown to the patient. The VEP is an evoked
electrophysiological potential that can be extracted, using signal
averaging, from the electroencephalographic activity recorded at the
scalp. Both ERG and VEP were differentially amplified band pass filtred
(0,1,30 Hz), recorded over 300 ms epochs, and signal average. 2 trials
were given. The visual evoked potential to flash stimulation consists
of a series of negative and positive waves. The earliest detectable
response has a peak latency of approximately 30ms post-stimulus. For
the flash VEP, the most robust components are the N2 and P2 peaks.
Measurements of P2 amplitude should be made from the positive P2 peak
at around 207.3 ms. The ERG recorded in BT189 showed an absence of
responses. While the VEP showed a normal responses in both eyes. These
traces confirm the evidence of a significant bilateral global retinal
degeneration. Only cone flicker responses of less than 15% of the
normal mean were recordable under photopic conditions while all other
responses were below noise level, a typical finding for patients with
retinitis pigmentosa.