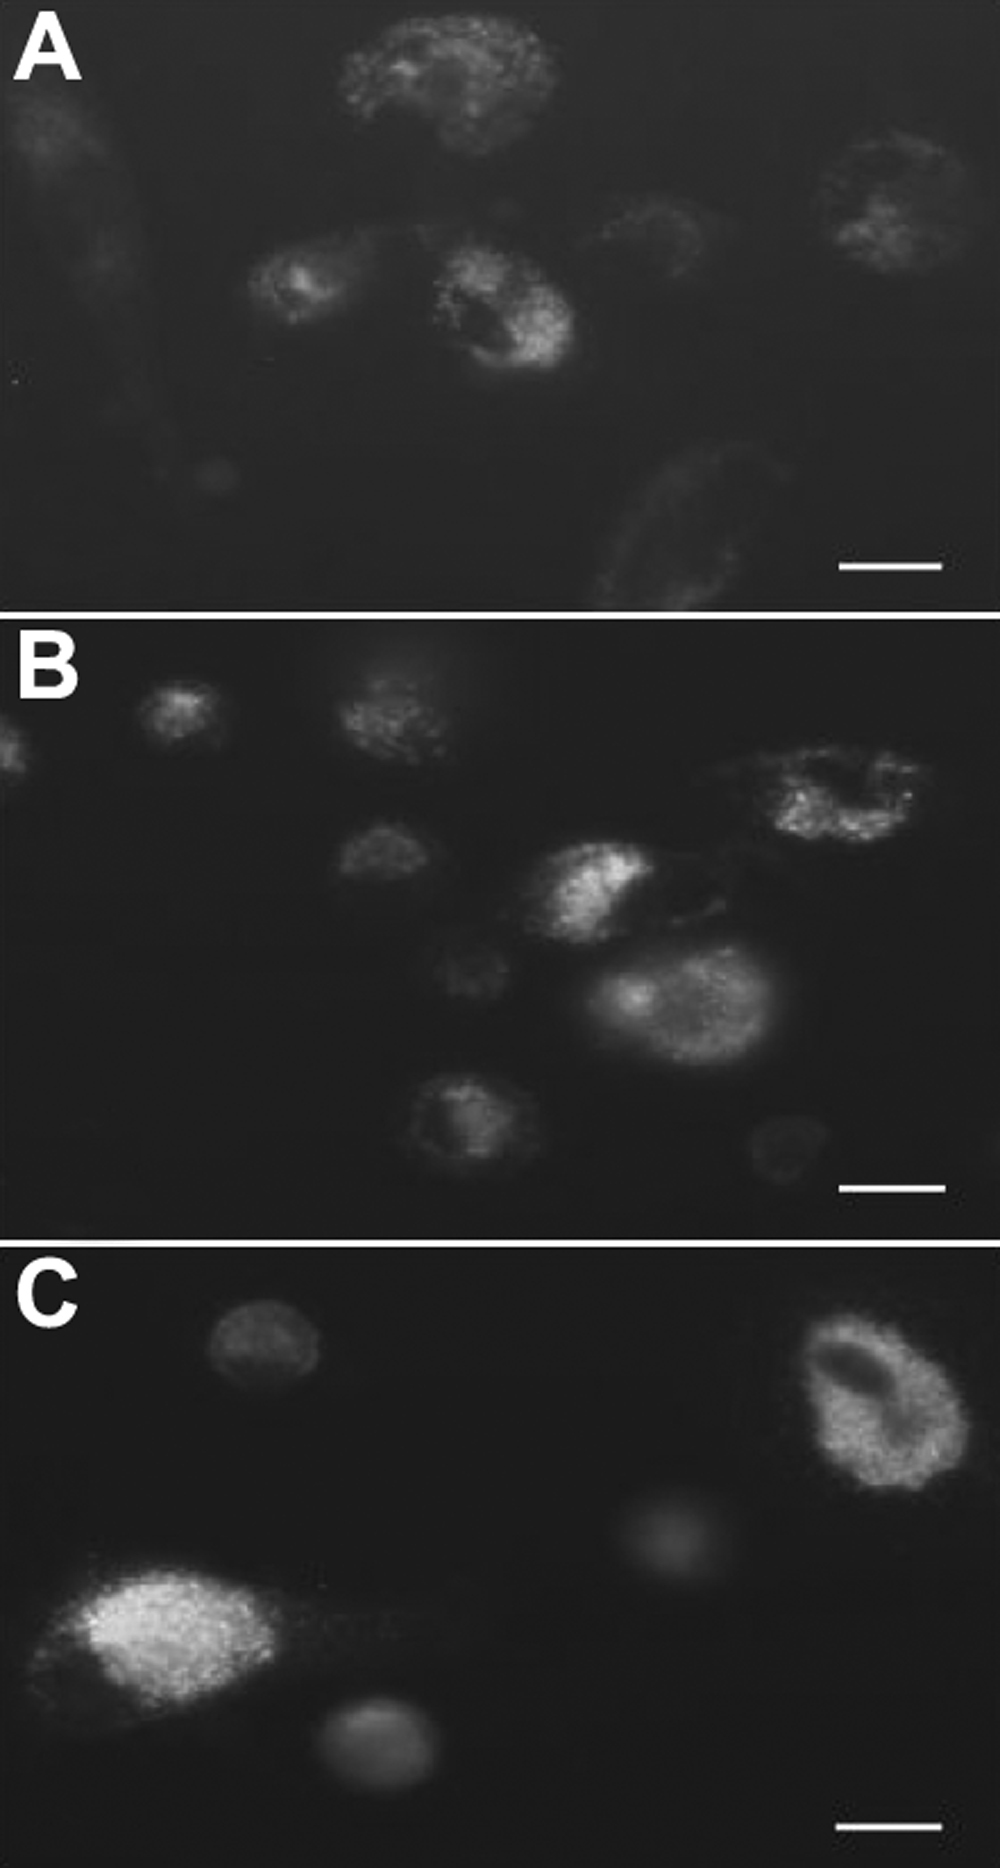
Figure 3. Immunofluorescent staining of
cytochrome c in cultured corneal endothelial cells. Cells were
incubated either in the absence of mitomycin C for 24 h (control, A)
or in the presence of 0.001 mg/ml (B) and 0.01 mg/ml (C)
mitomycin C for 24 h. The intensity of fluorescence staining with
cytochrome c was gradually enhanced from the control cells to
the apoptotic cells. Apoptotic changes throughout the cytosol were
clearly visible following exposure to 0.01 mg/ml mitomycin C for 24 h.
The bar in each panel represents 5 μm. Two other independent
experiments produced similar results.