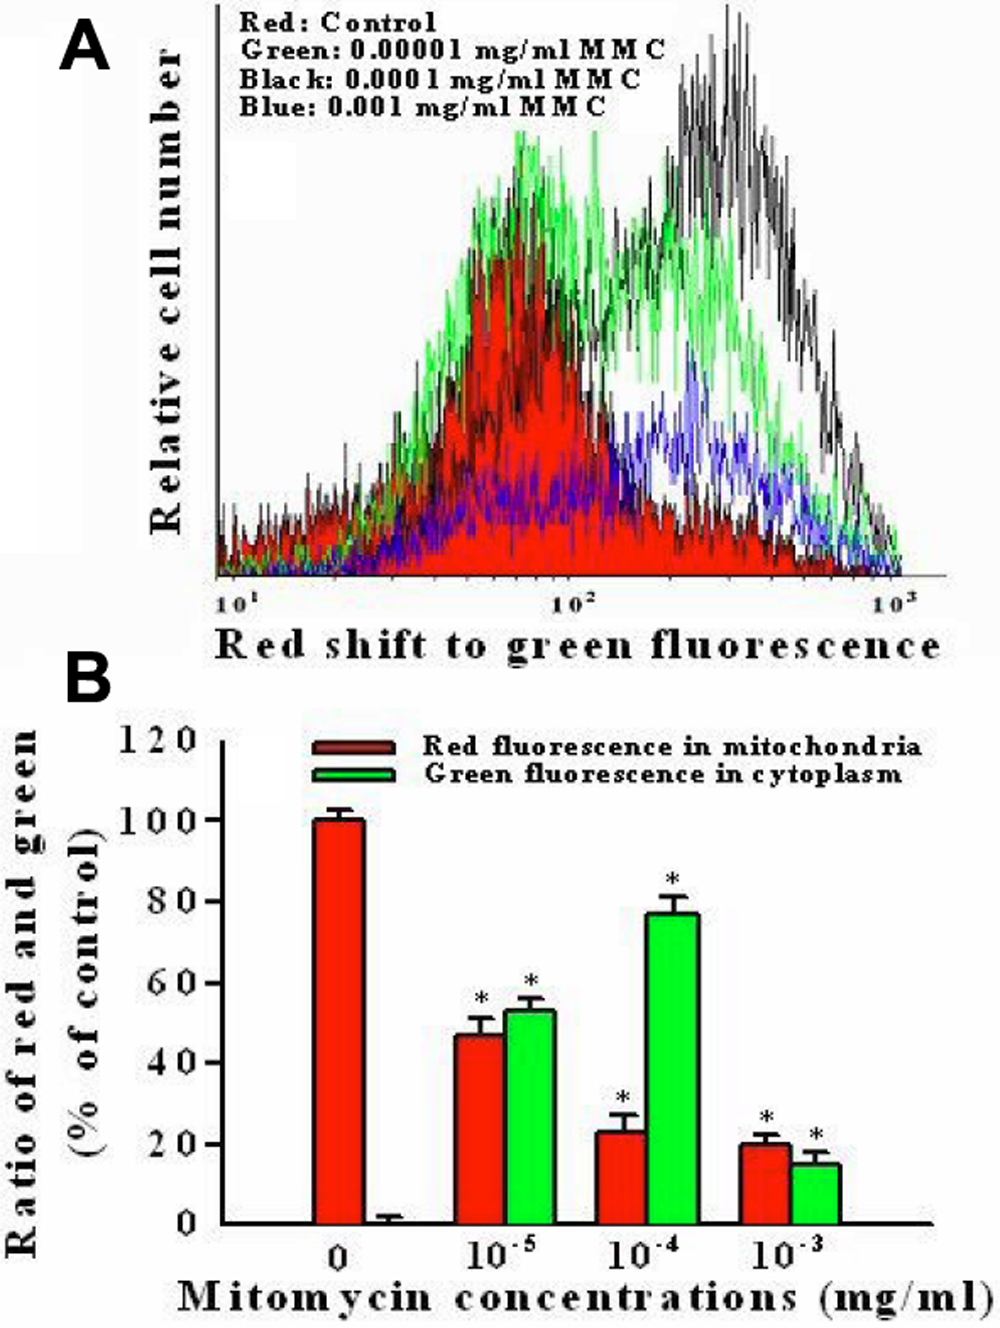
Figure 2. Flow cytomety assay of
mitochondrial membrane potential changes with MitoLight dye in cultured
porcine corneal endothelial cells under exposure to 0.00001, 0.0001,
and 0.001 mg/ml mitomycin C for 24 h. A: The curves represent
fluorescent changes in the absence of mitomycin C for 24 h (control,
red color) or in the presence of 0.00001 (green color), 0.0001 (black
color) and 0.001 (blue color) mg/ml mitomycin C. B: It is
displayed the ratio of red fluorescence in the mitochondria and green
fluorescence in the cytoplasm at different concentrations of mitomycin
C with histogram. The asterisk denotes that p<0.05 when comparing
the red and green fluorescence with control group. Two other
independent experiments produced similar results.