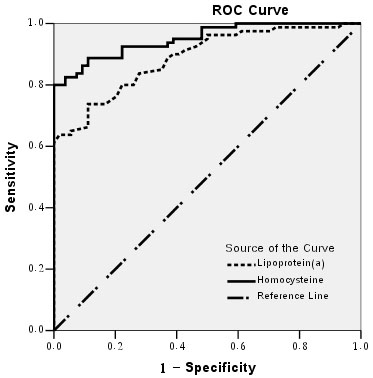
Figure 4. Receiver operating
characteristic curves for arteriosclerosis. Shown is the relationship
of sensitivity to 1-specificity as plotted for lipoprotein(a) and
homocysteine. The area under each receiver operating characteristic
(ROC) curve for each parameter indicates its diagnostic accuracy (
Table 3).