Figure 3 of
Ghorbanihaghjo, Mol Vis 2008; 14:1692-1697.
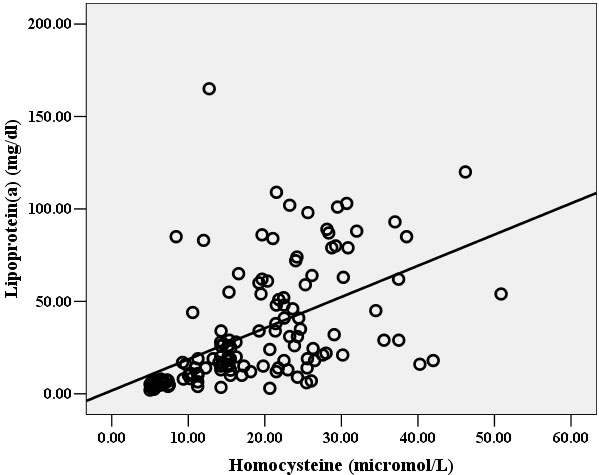
Figure 3.
Correlation of Hcy level with Lp(a) level. There was a direct linear correlation between Hcy and Lp(a) levels in the study population (r=0.67, p<0.01), i.e., higher level of Hcy was associated with higher level of Lp(a).