Figure 3. Confocal images of the sclera-choroid-RPE combination at the end of 24 h nanoparticle (20 nm) transport study. Panel A shows the fluorescence image and Panel B shows the combination (fluorescence plus phase contrast) image of the control sclera-choroid-RPE tissue. Panel C shows the fluorescence and Panel D shows the combination (fluorescence plus phase contrast) image of the sclera-choroid-RPE tissue that was exposed to nanoparticles
during the transport study. In each panel, the scleral (donor) side is on the left and the vitreal (receiver) side is on the
right. The particles are concentrated on the outer edge of the sclera. There are very few or no particles seen on the vitreal
side of the tissue.
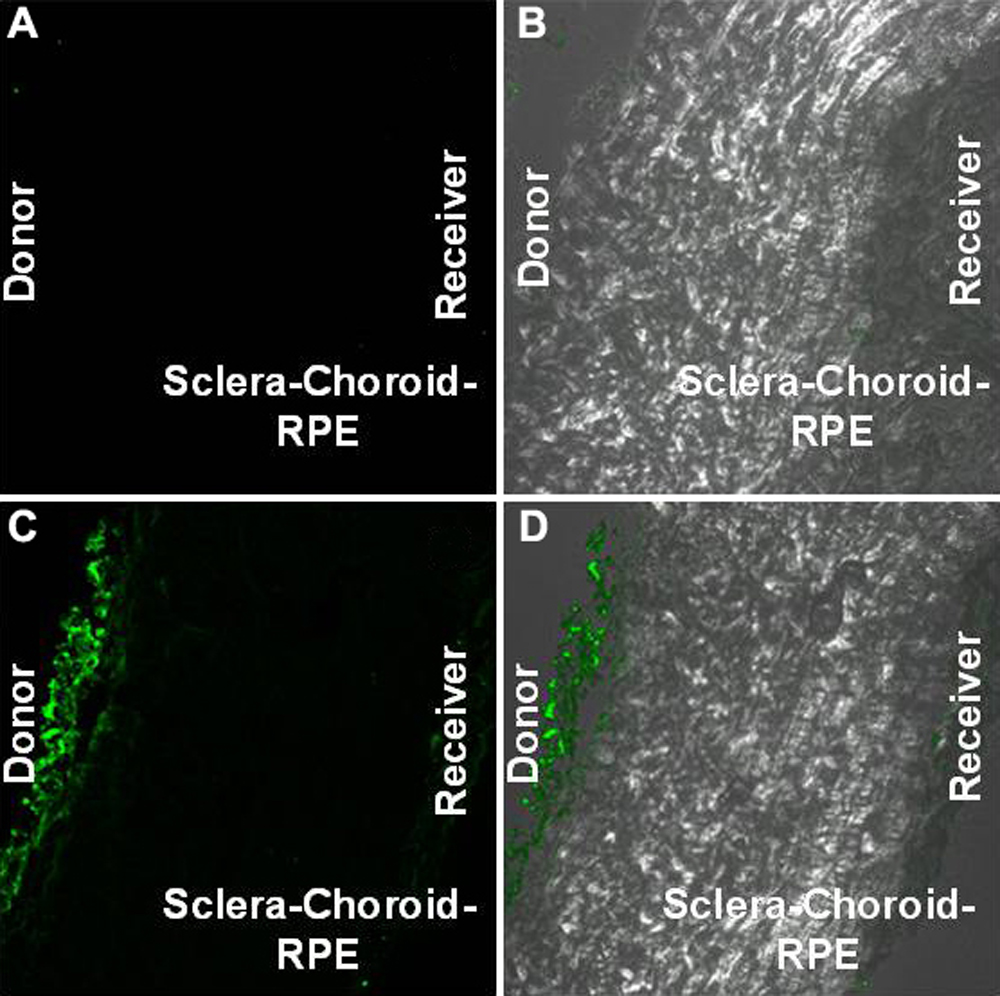
 Figure 3 of
Amrite, Mol Vis 2008; 14:150-160.
Figure 3 of
Amrite, Mol Vis 2008; 14:150-160.