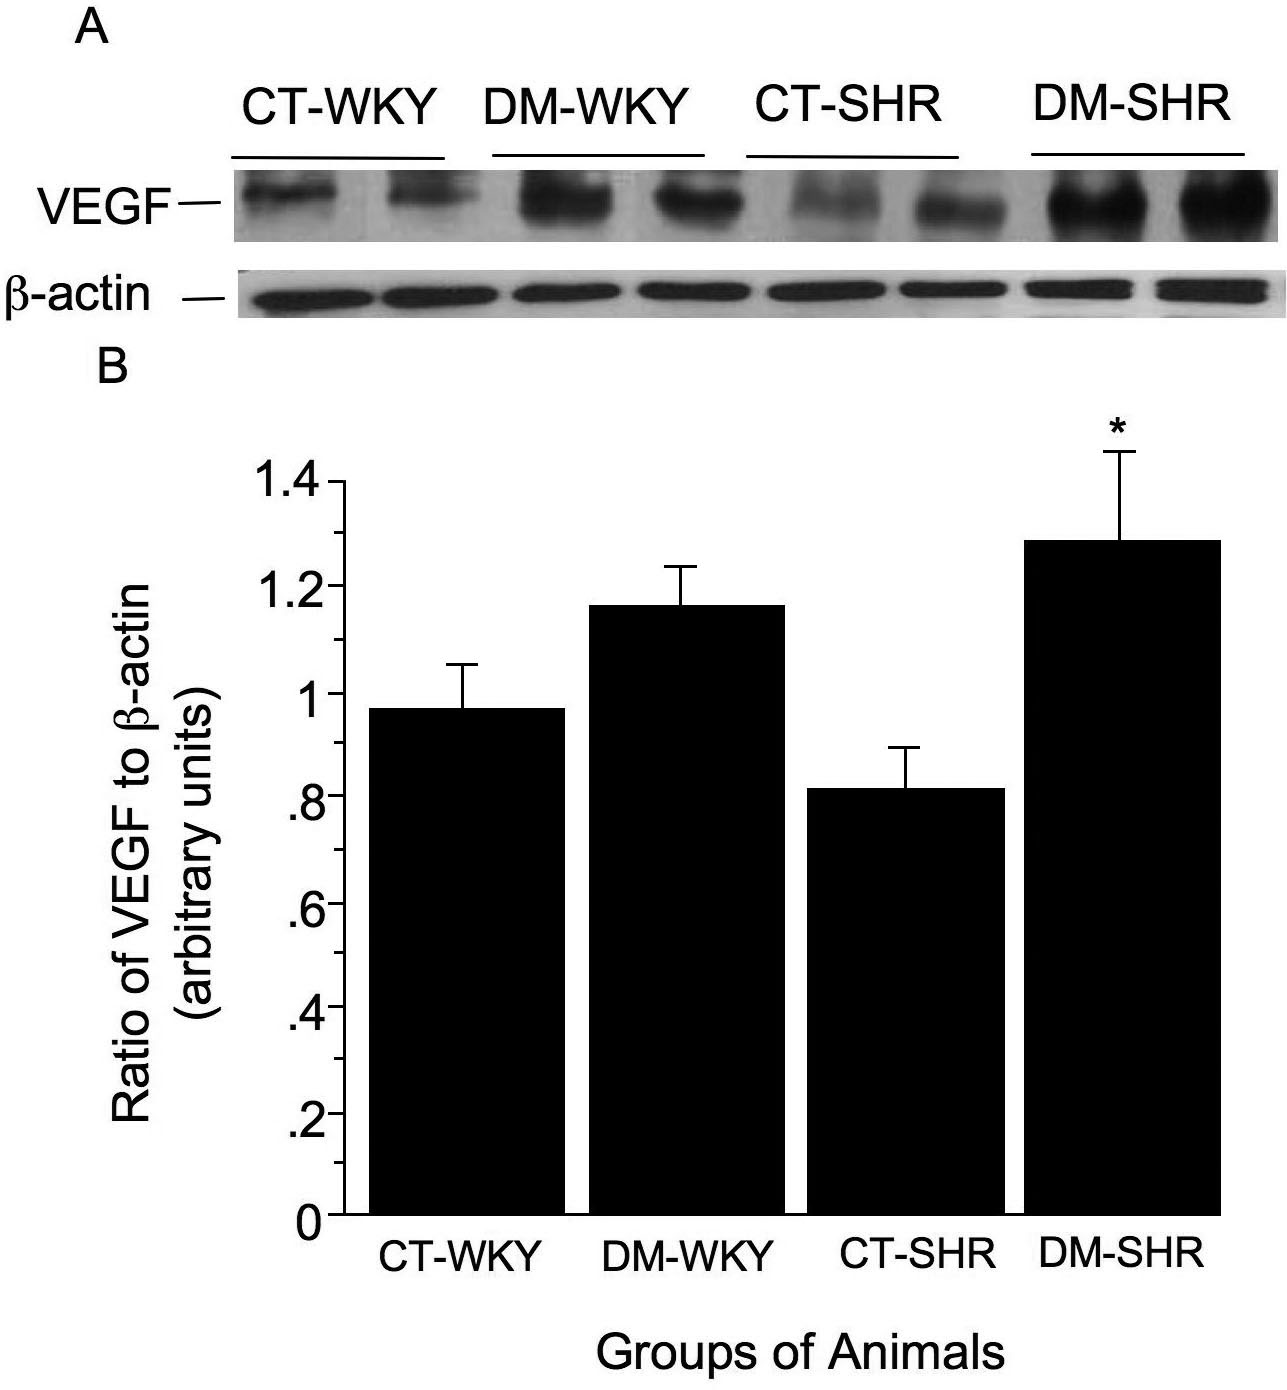
Figure 7. Retinal expression of vascular
endothelial growth factor (VEGF) was accessed by western blot assay. In
A, the membranes were incubated with antibody against VEGF in total
retinal lysates. B: The graph display the band densities (ratio of VEGF
to β actin) expressed in arbitrary densitometric units. The columns are
the mean±SD of four experiments. The used symbols are CT-WKY for
control WKY, DM-WKY for diabetic WKY, CT-SHR for control SHR and DM-SHR
for diabetic SHR. Asterisk (*) is p=0.02 versus other groups.