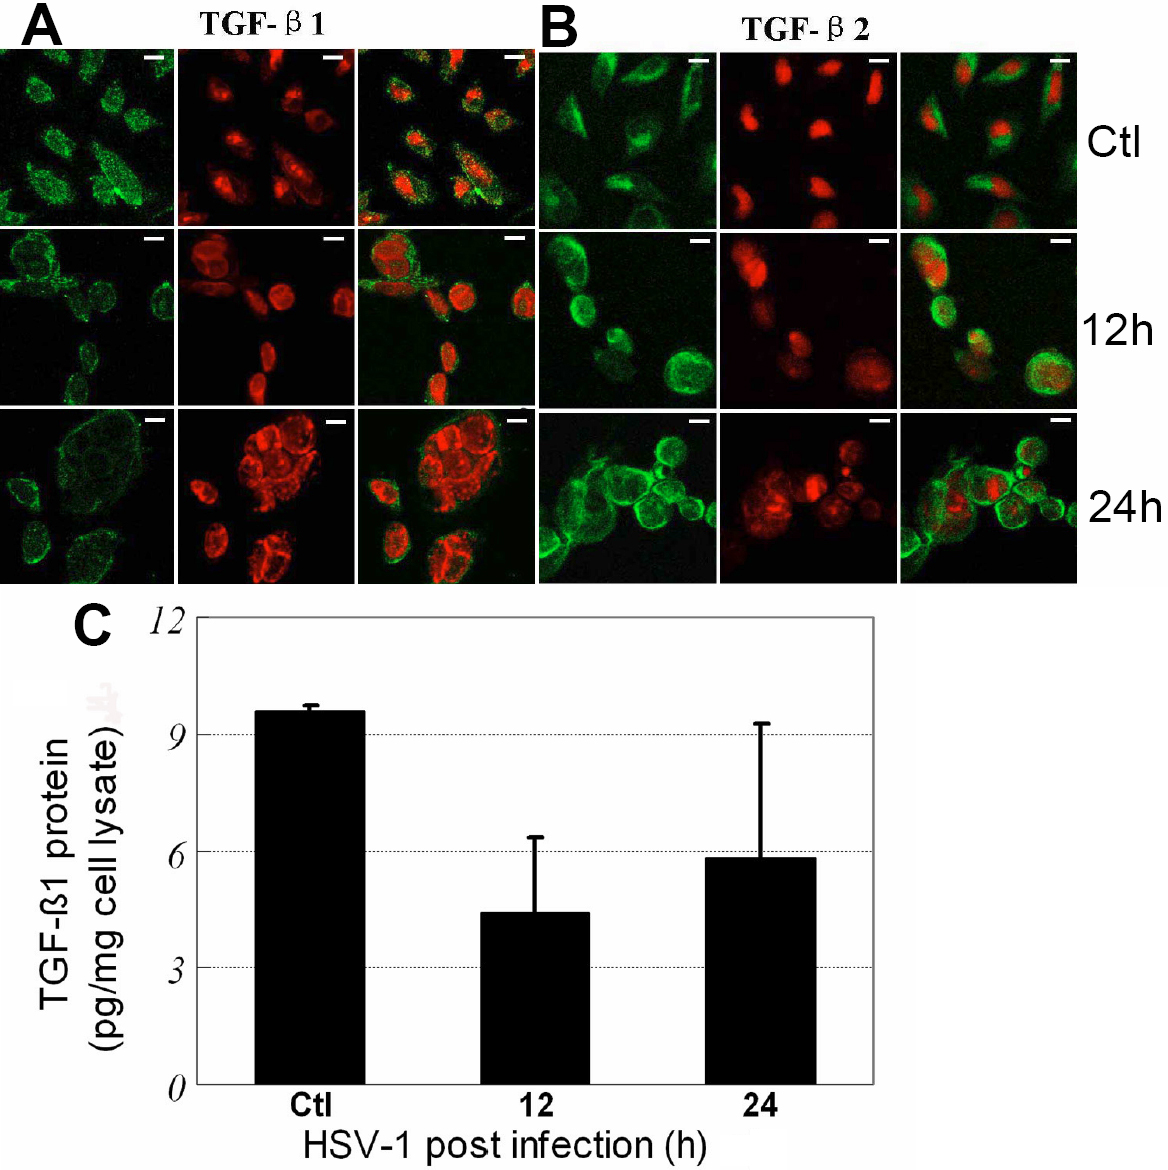
Figure 3. Protein expression of TGF-β1 and
TGF-β2 in human corneal epithelial cells infected with HSV-1. In A
and B, indirect immunofluorescence analysis was used to find
the protein expression in cells. FITC marked the secondary antibody
(green; left), and PI dyed the nucleus (red; middle). Merged images
were showed at the right of A and B. Scale bar: 10 μm. C:
The expression of TGF-β1 by ELISA in HCE cells infected with HSV-1 was
measured at 0 h, 12 h, and 24 h p.i. Significant decreases of the
TGF-β1 protein in cell lysates were seen in both 12 h and 24 h
post-infected cells (p<0.05). Each data was the mean value of four
independent assays.