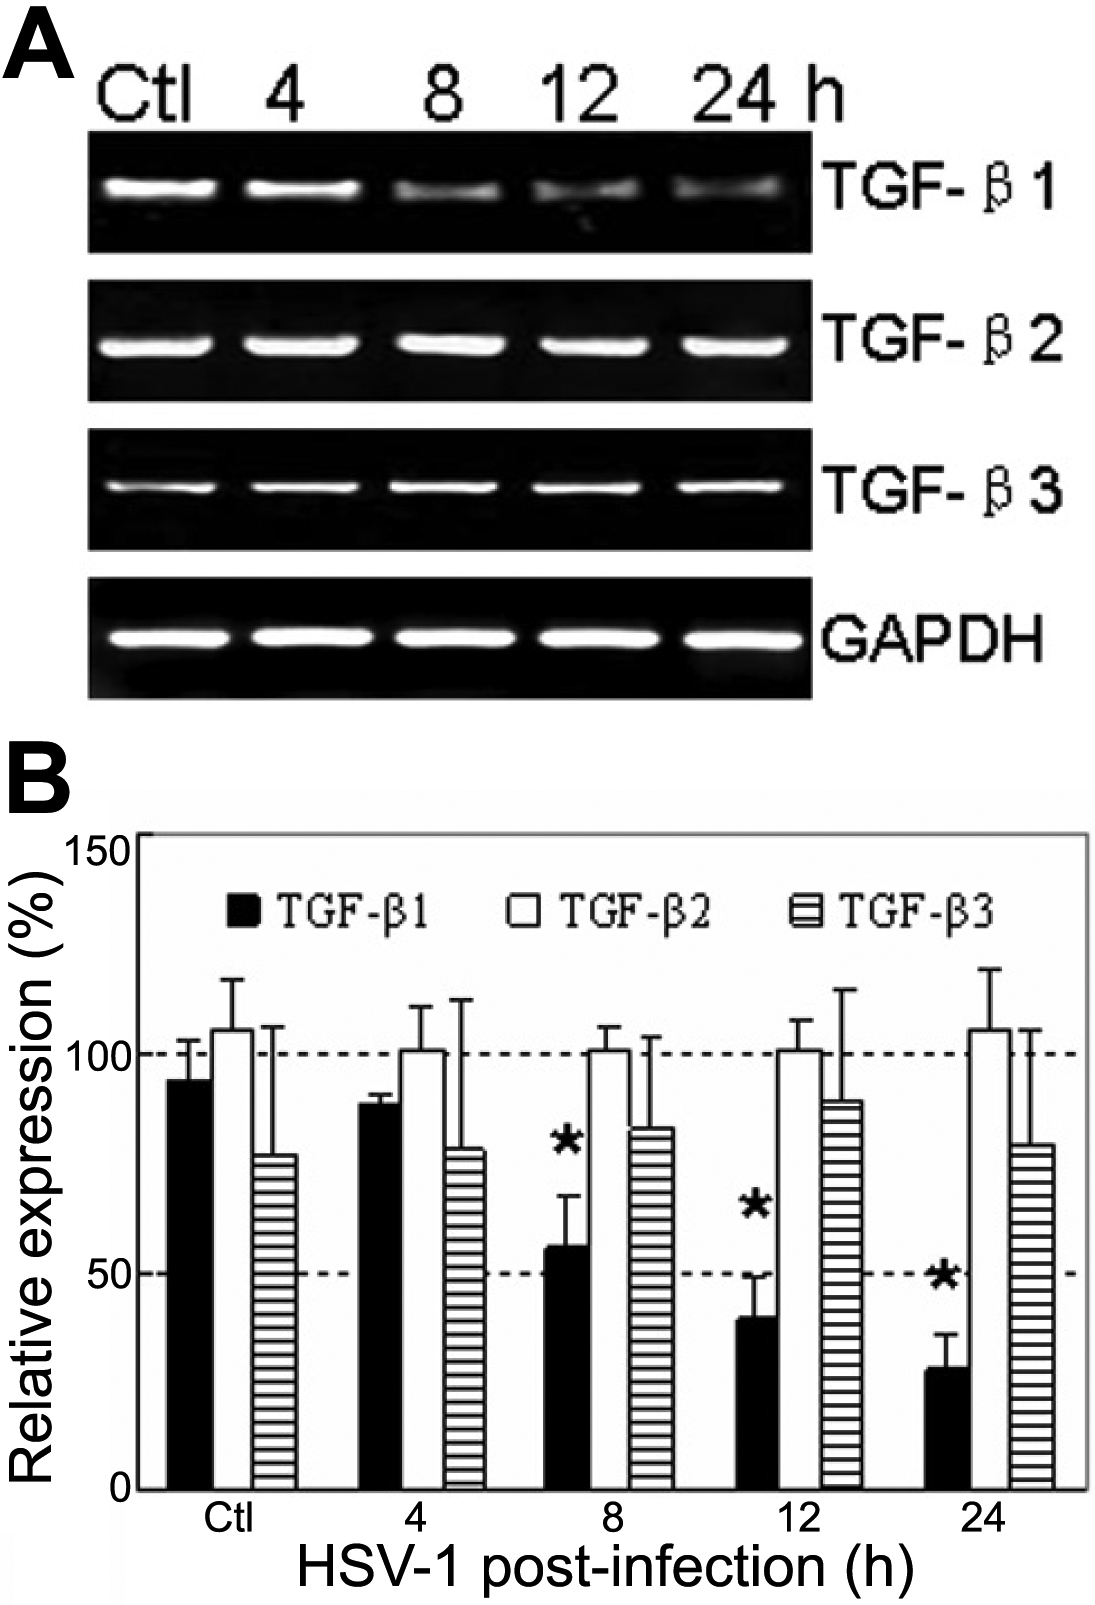
Figure 2. Reverse transcription polymerase
chain reaction analysis of the TGF-β isoforms in human corneal
epithelial cells infected with HSV-1. A: Products of RT-PCR
that were run on 2% agarose gel electrophoresis. The intensities of TGF-β1
bands decreased significantly at 8 h, 12 h, and 24 h p.i., while that
of TGF-β2 and TGF-β3 bands unchanged. GAPDH was
used as an internal control. B: The level of mRNA was expressed
as the ratio of integrated optical density (IOD) of specific PCR
products over GAPDH IOD. Each data was the mean value of three
independent experiments. Single asterisks indicate significant
differences (p<0.05).