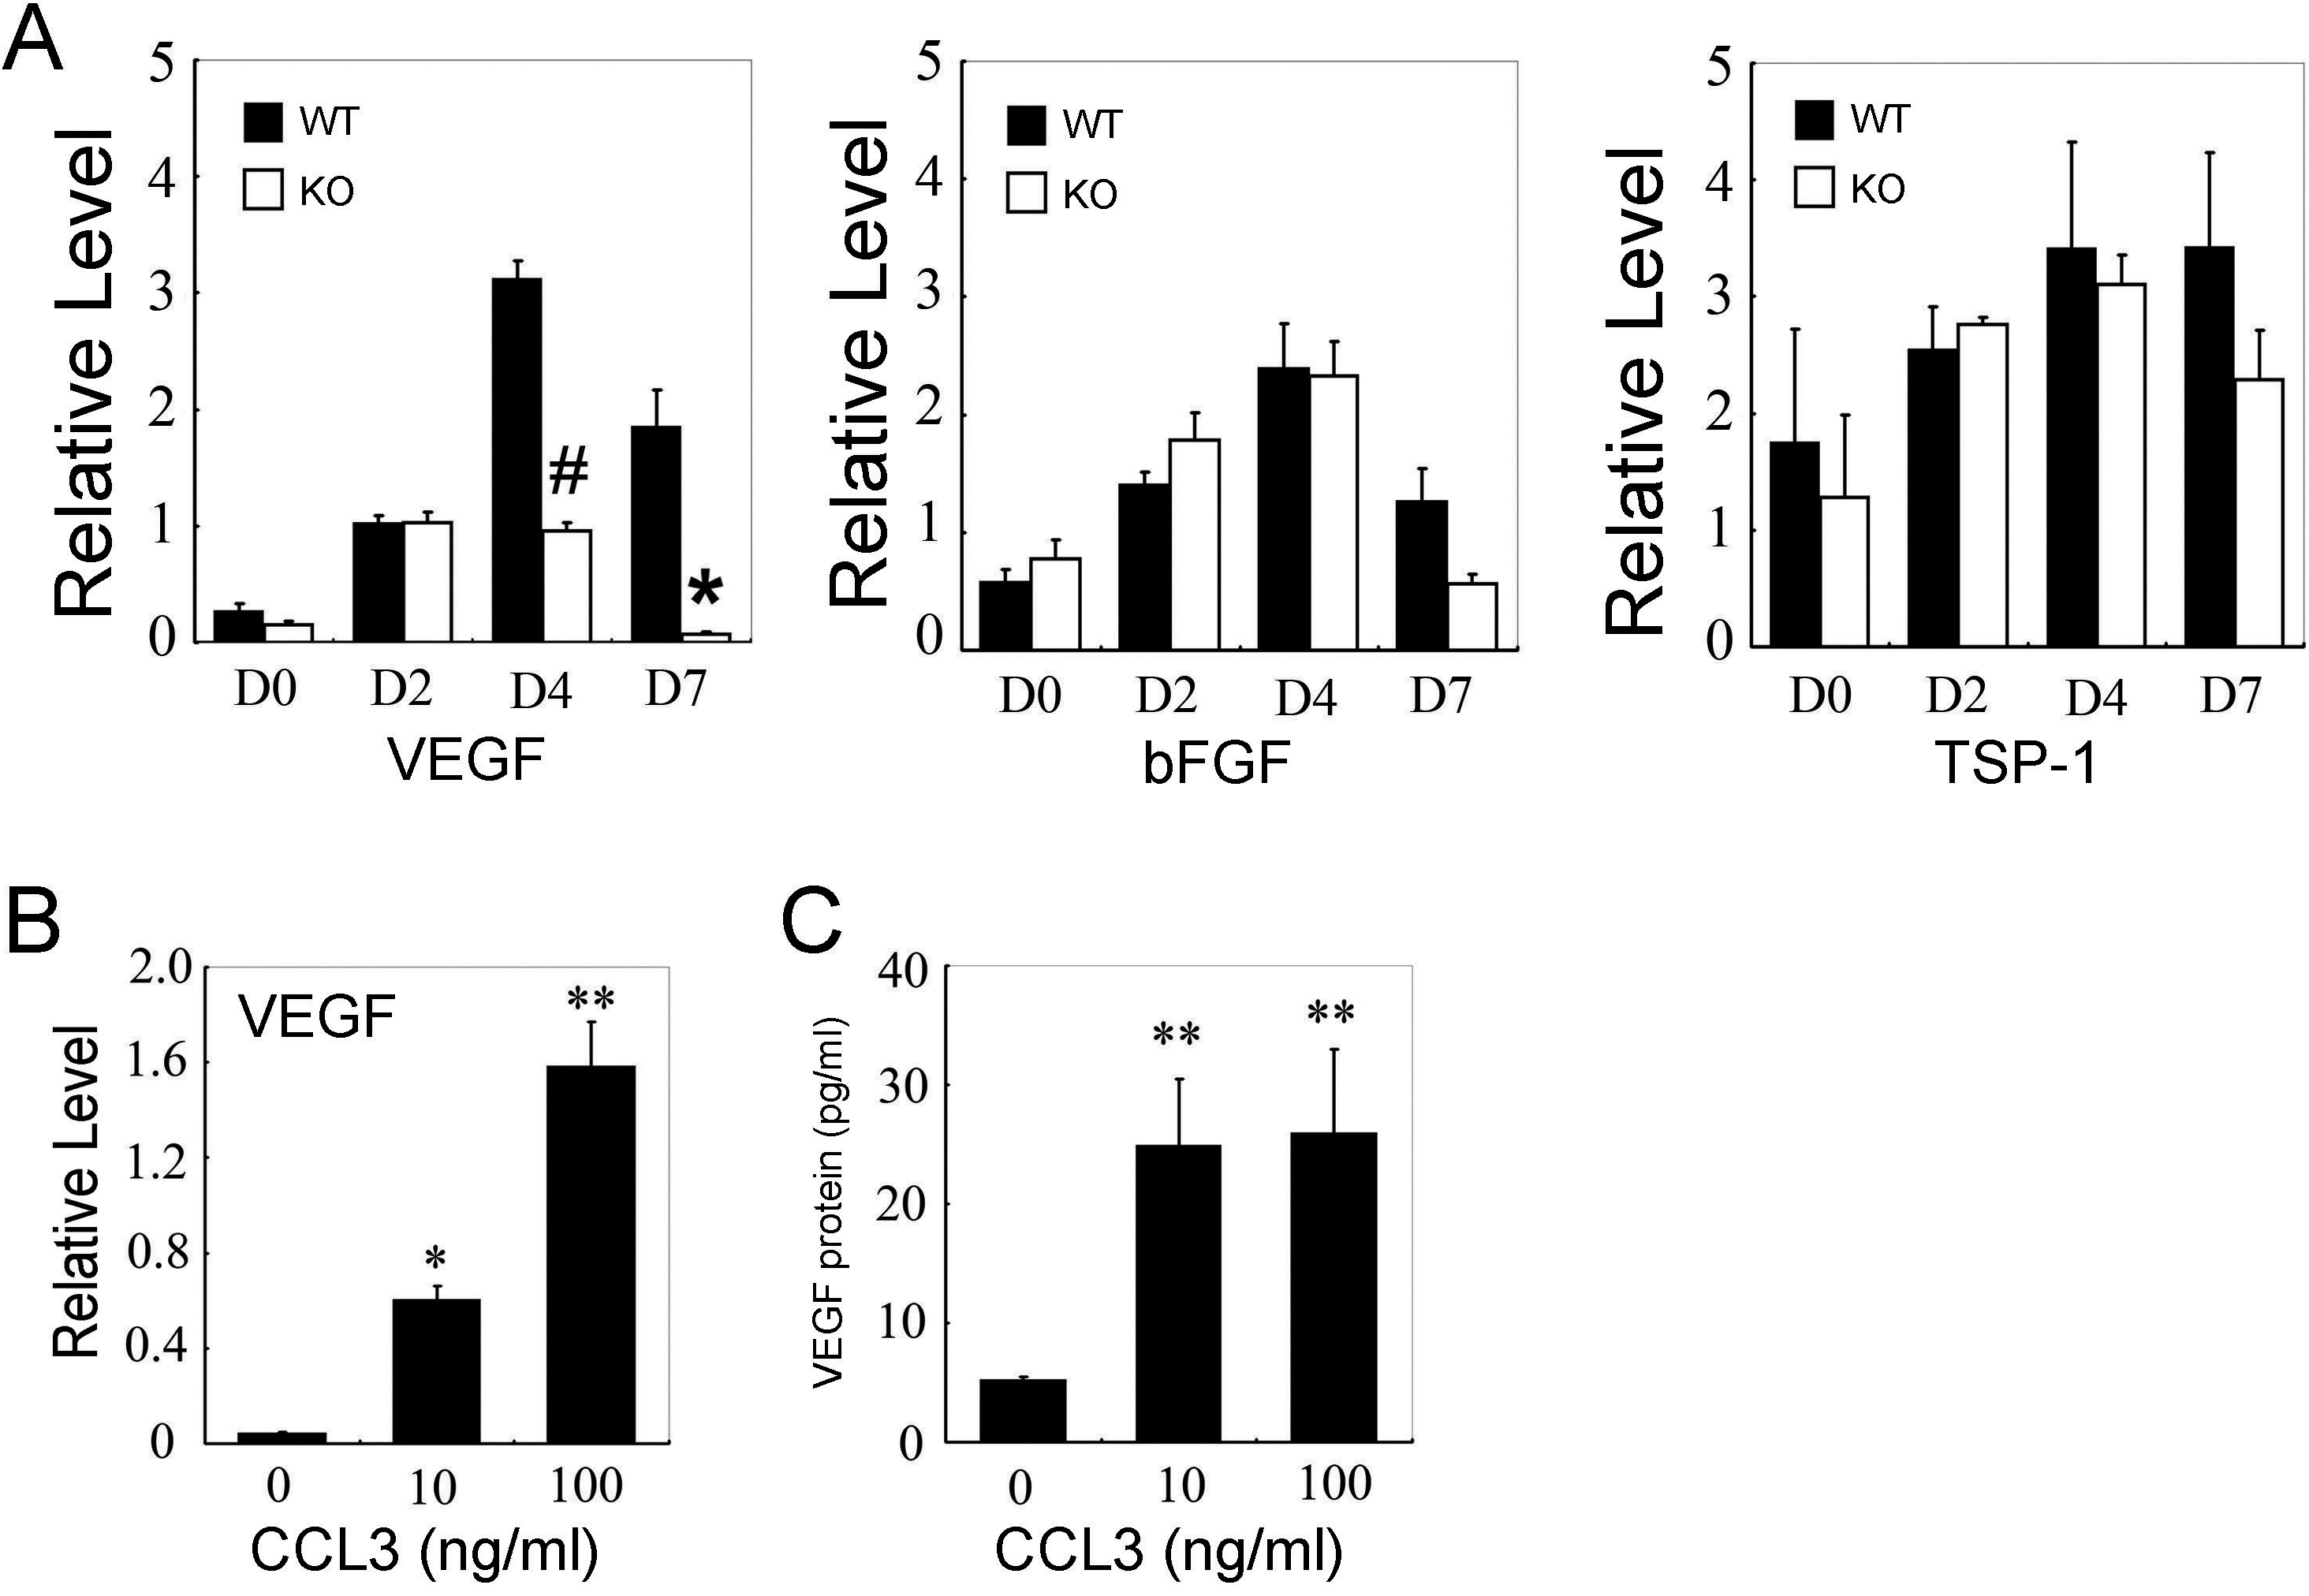
Figure 3. Angiogenic factor expression. A:
RT–PCR analysis of pro-angiogenic and anti-angiogenic gene expressions
in the injured corneas of WT and CCL3-KO mice. RT–PCR analysis was
performed on total RNAs extracted from eyes 0, 2, 4, and 7 days after
alkali injury, and then the ratios of VEGF to β-actin, bFGF to β-actin,
and TSP-1 to β-actin of WT (black bars) and CCL3-KO mice (open bars)
were determined. All values represent the mean and SEM (n=3-5 animals).
The asterisk denotes a p<0.05; the hash mark denotes a p<0.01 and
that the value was obtained comparing WT and KO mice. The effects of
CCL3 on VEGF expression by murine peritoneal macrophages is shown in B
and C. B: RT–PCR was performed on macrophages incubated
with the indicated concentrations of CCL3 for 12 h, and the ratio of
VEGF to β-actin was calculated. Each value represents the mean and SEM
(n=3). C: Murine macrophages were stimulated with either 0, 10,
or 100 ng/ml of CCL3 for 24 h. VEGF concentrations in the supernatants
were determined with ELISA as described in Methods. The representative
results from three independent experiments are shown. The asterisk
denotes a p<0.05 and the double asterisk denotes a p<0.01 when
compared to untreated.