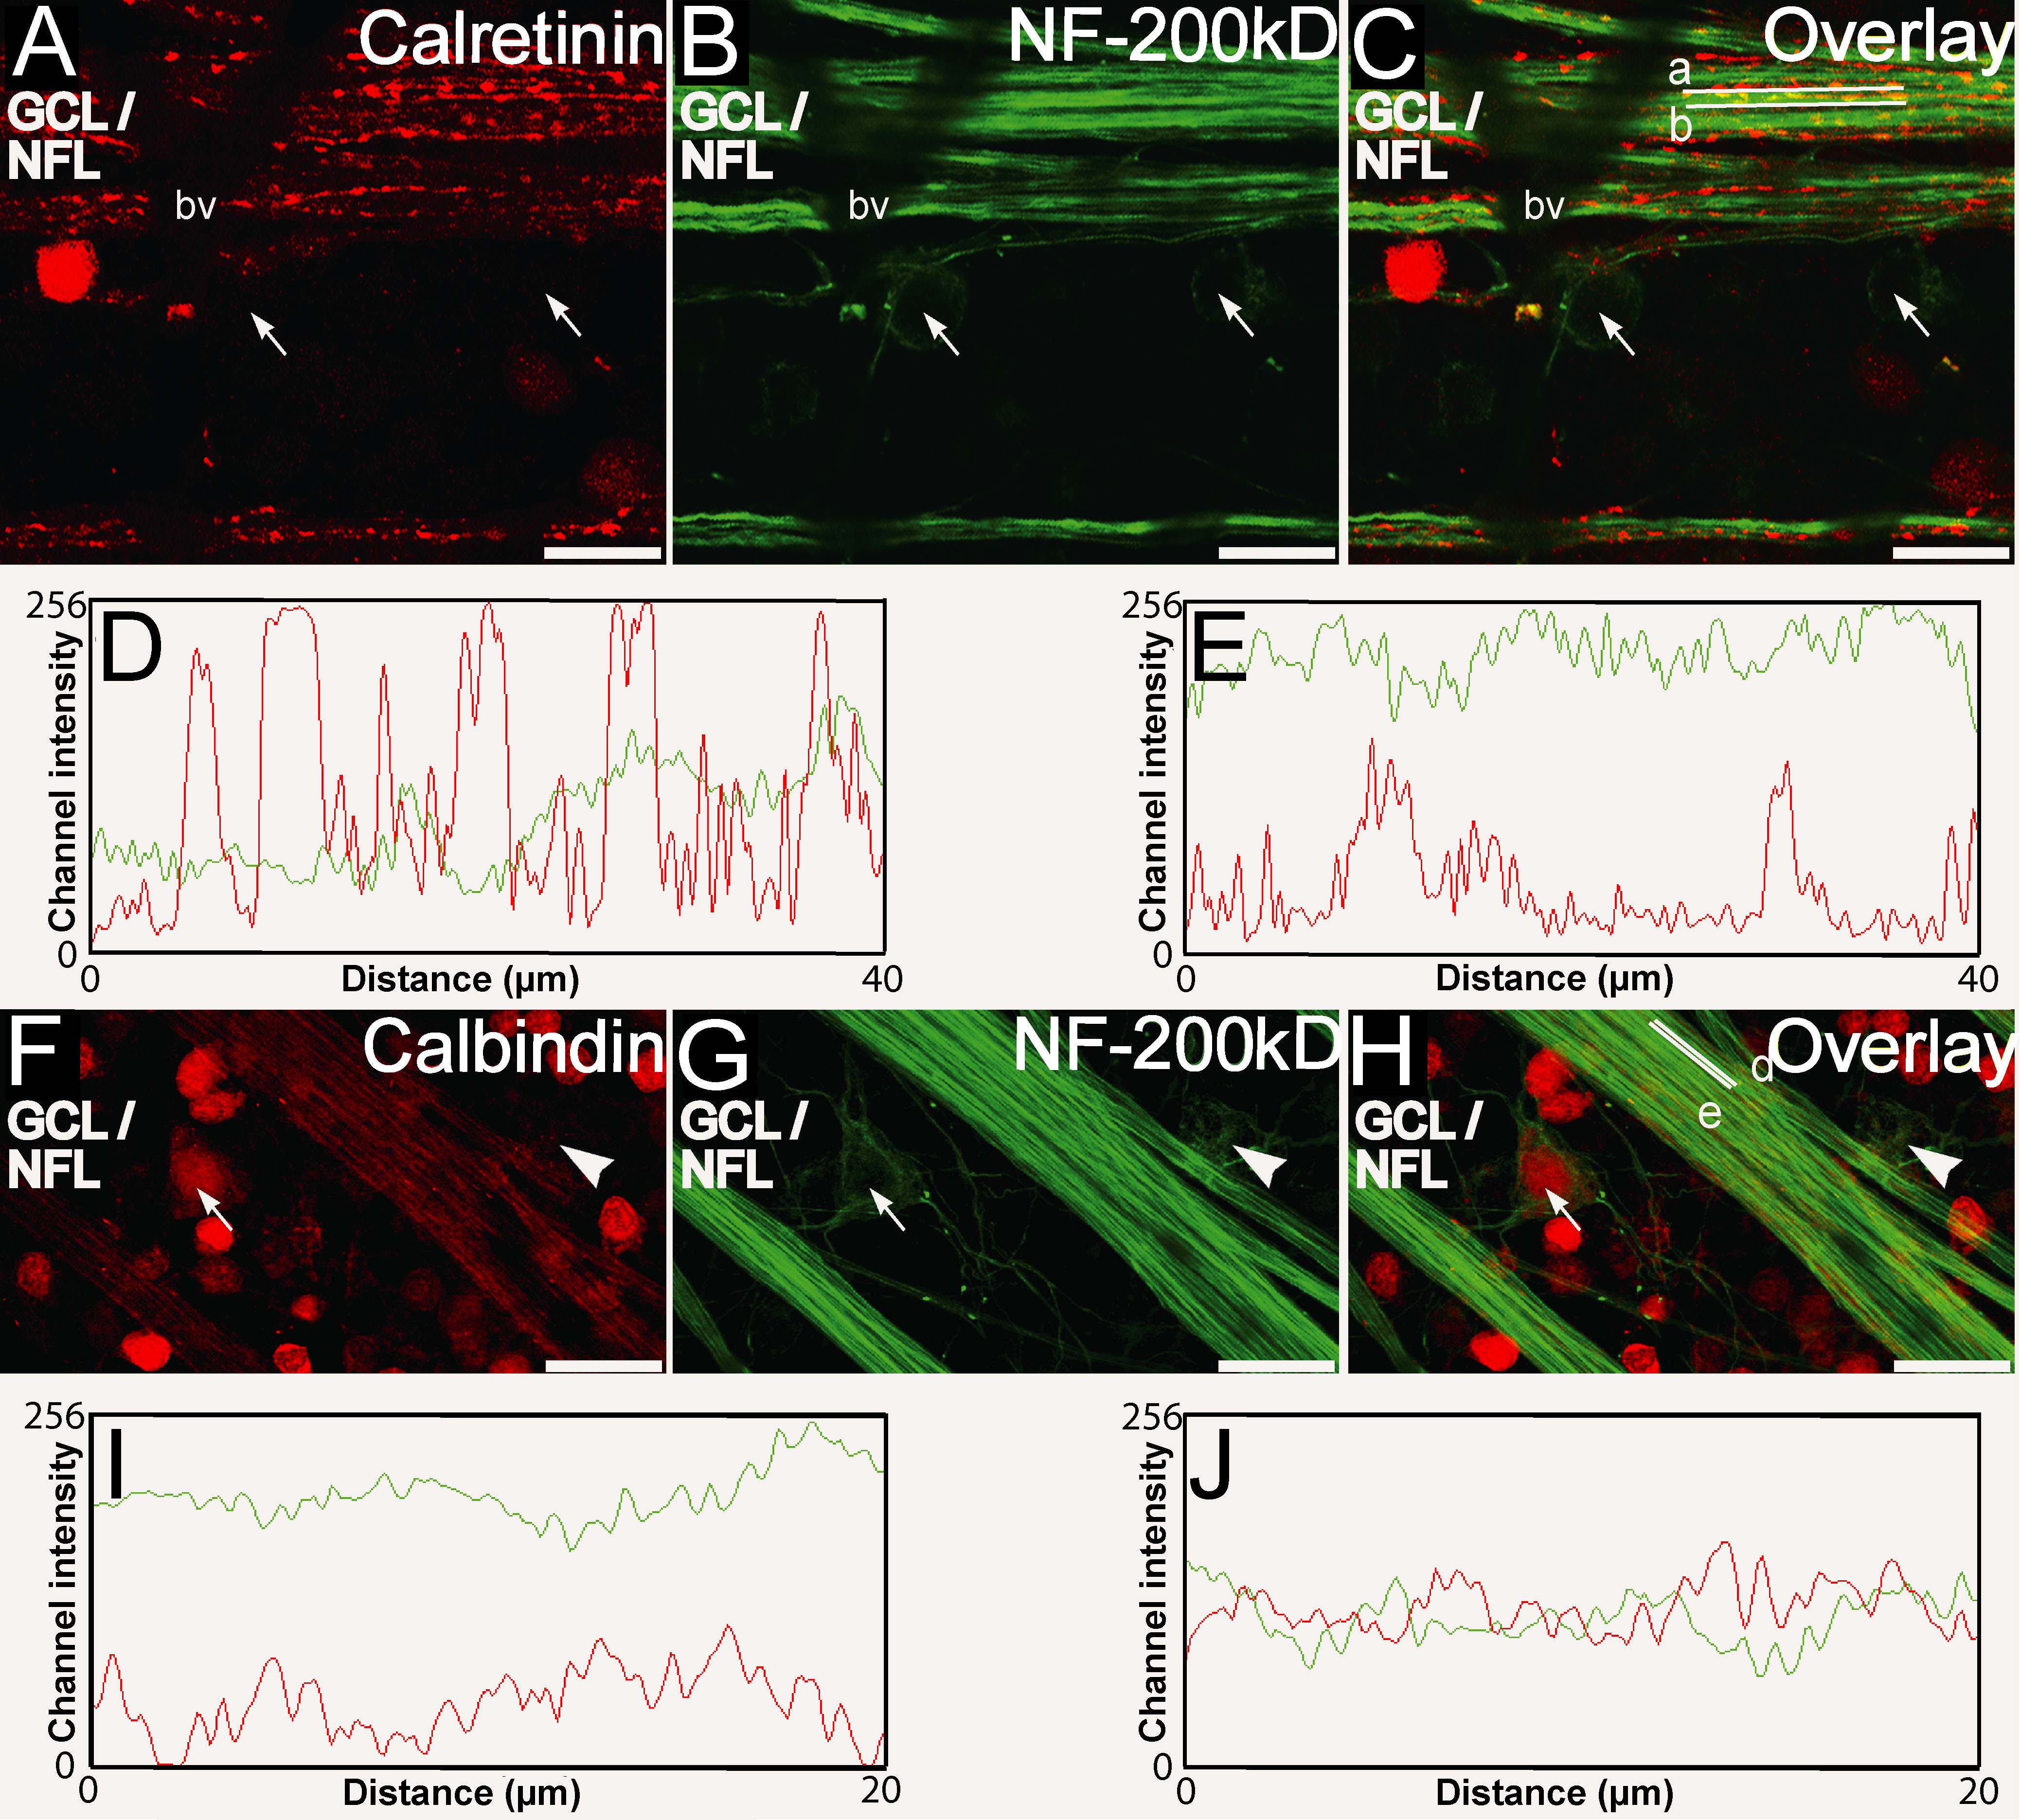
Figure 8. Calretinin, calbindin-28 kDa,
and NF-200 kDa immunofluorescence in the ganglion cell layer
(GCL)/nerve fiber layer (NFL) as seen in retinal whole-mounts. A-C:
Double labeling for calretinin (red) and NF-200 kDa (green) shows
retinal ganglion cell (RGC) somata, surrounded peripherally by light
NF-200 kDa immunofluorescence (arrows), that were not immunopositive
for calretinin. Calretinin immunofluorescence was present at discrete
locations intermittently along the long axis of the RGC nerve fiber,
whereas the NF-200 kDa immunofluorescence was uniform. Channel
intensity profiles for the red and green channels along the long axis
(lines a and b in C shown in D and E
respectively) revealed that for regions on the long axis where staining
for calretinin was prominent, staining for NF-200 kDa was less
prominent (D) and vice versa (E). F-H: Double
labeling for calbindin-28 kDa (red) and NF-200 kDa (green) showed that
calbindin-28 kDa-positive immunofluorescence was smoothly distributed
in the nerve fibers similar to NF-200 kDa. RGC somata that were
surrounded peripherally by light NF-200 kDa immunofluorescence (arrow)
were also stained with calbindin-28 kDa while for others (arrowhead)
staining was less prominent. Channel intensity profiles for the red and
green channels for straight lines along the long axis (lines d and e in
H shown in I and J respectively) presented some region
where immunofluorescence for NF-200 kDa was prominent while that for
calbindin-28 kDa was less prominent (I) and others where the
intensity profiles were similar (J). Scale bar represents 20
µm.Abbreviations: bv is blood vessel.