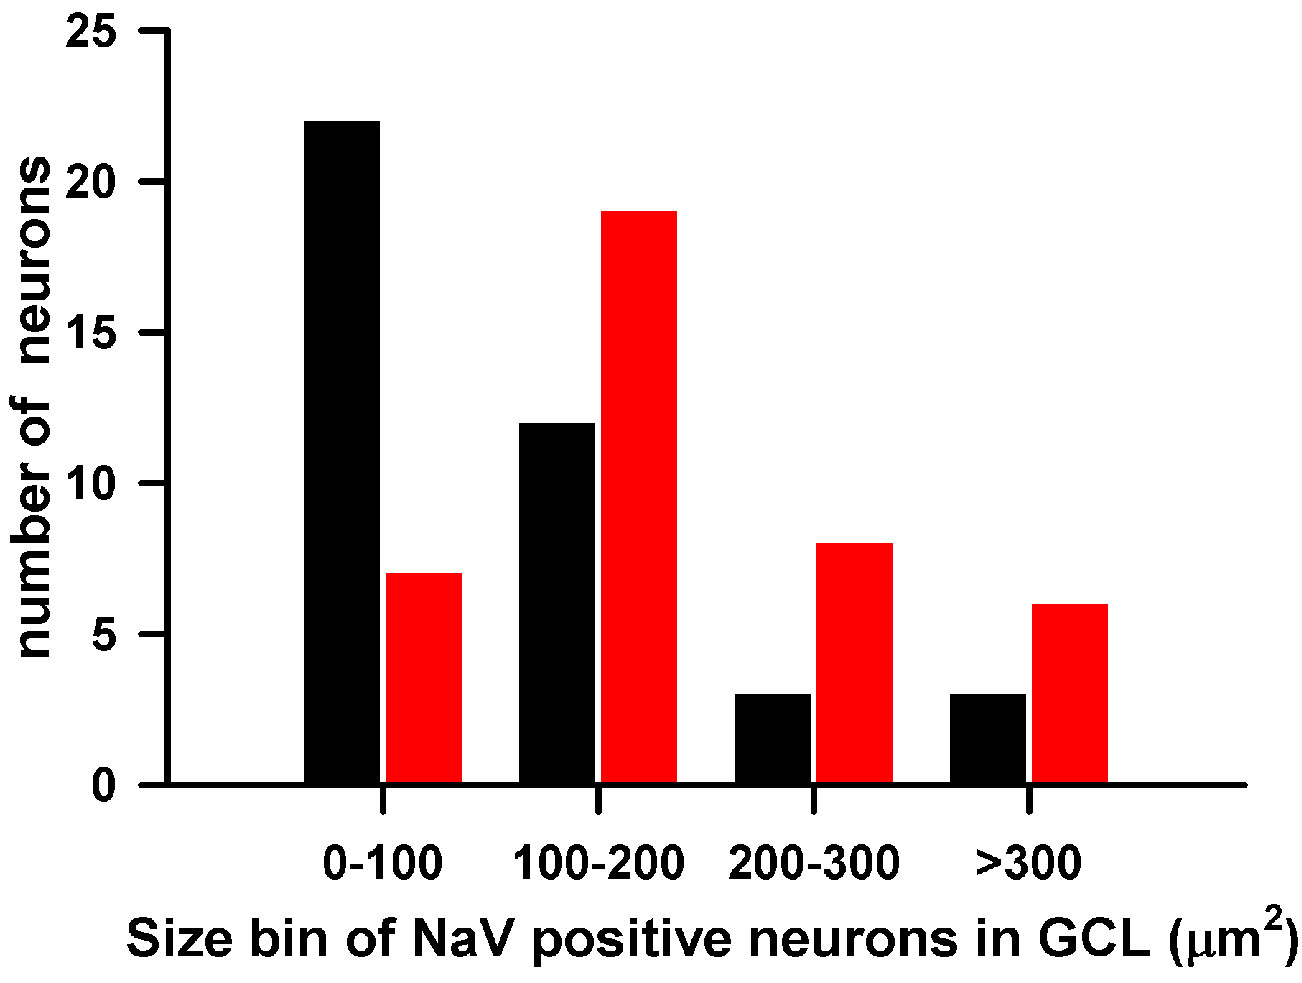
Figure 7. Size distributions of
Calcium-binding protein (CBP) immunopositive and immunonegative neurons
are shown. The histogram shows the surface area of projection of the
somata of neurons in the retinal ganglion cell (RGC) layer from retinal
whole mounts that were immunopositive for Pan-NaV only
(n=40, red) or Pan-NaV and calcium binding proteins (CBP;
n=40, black). The histogram is based on projections of all optical
planes corresponding to the RGC layer from five midperipheral retinal
areas (256 μm × 256 μm).