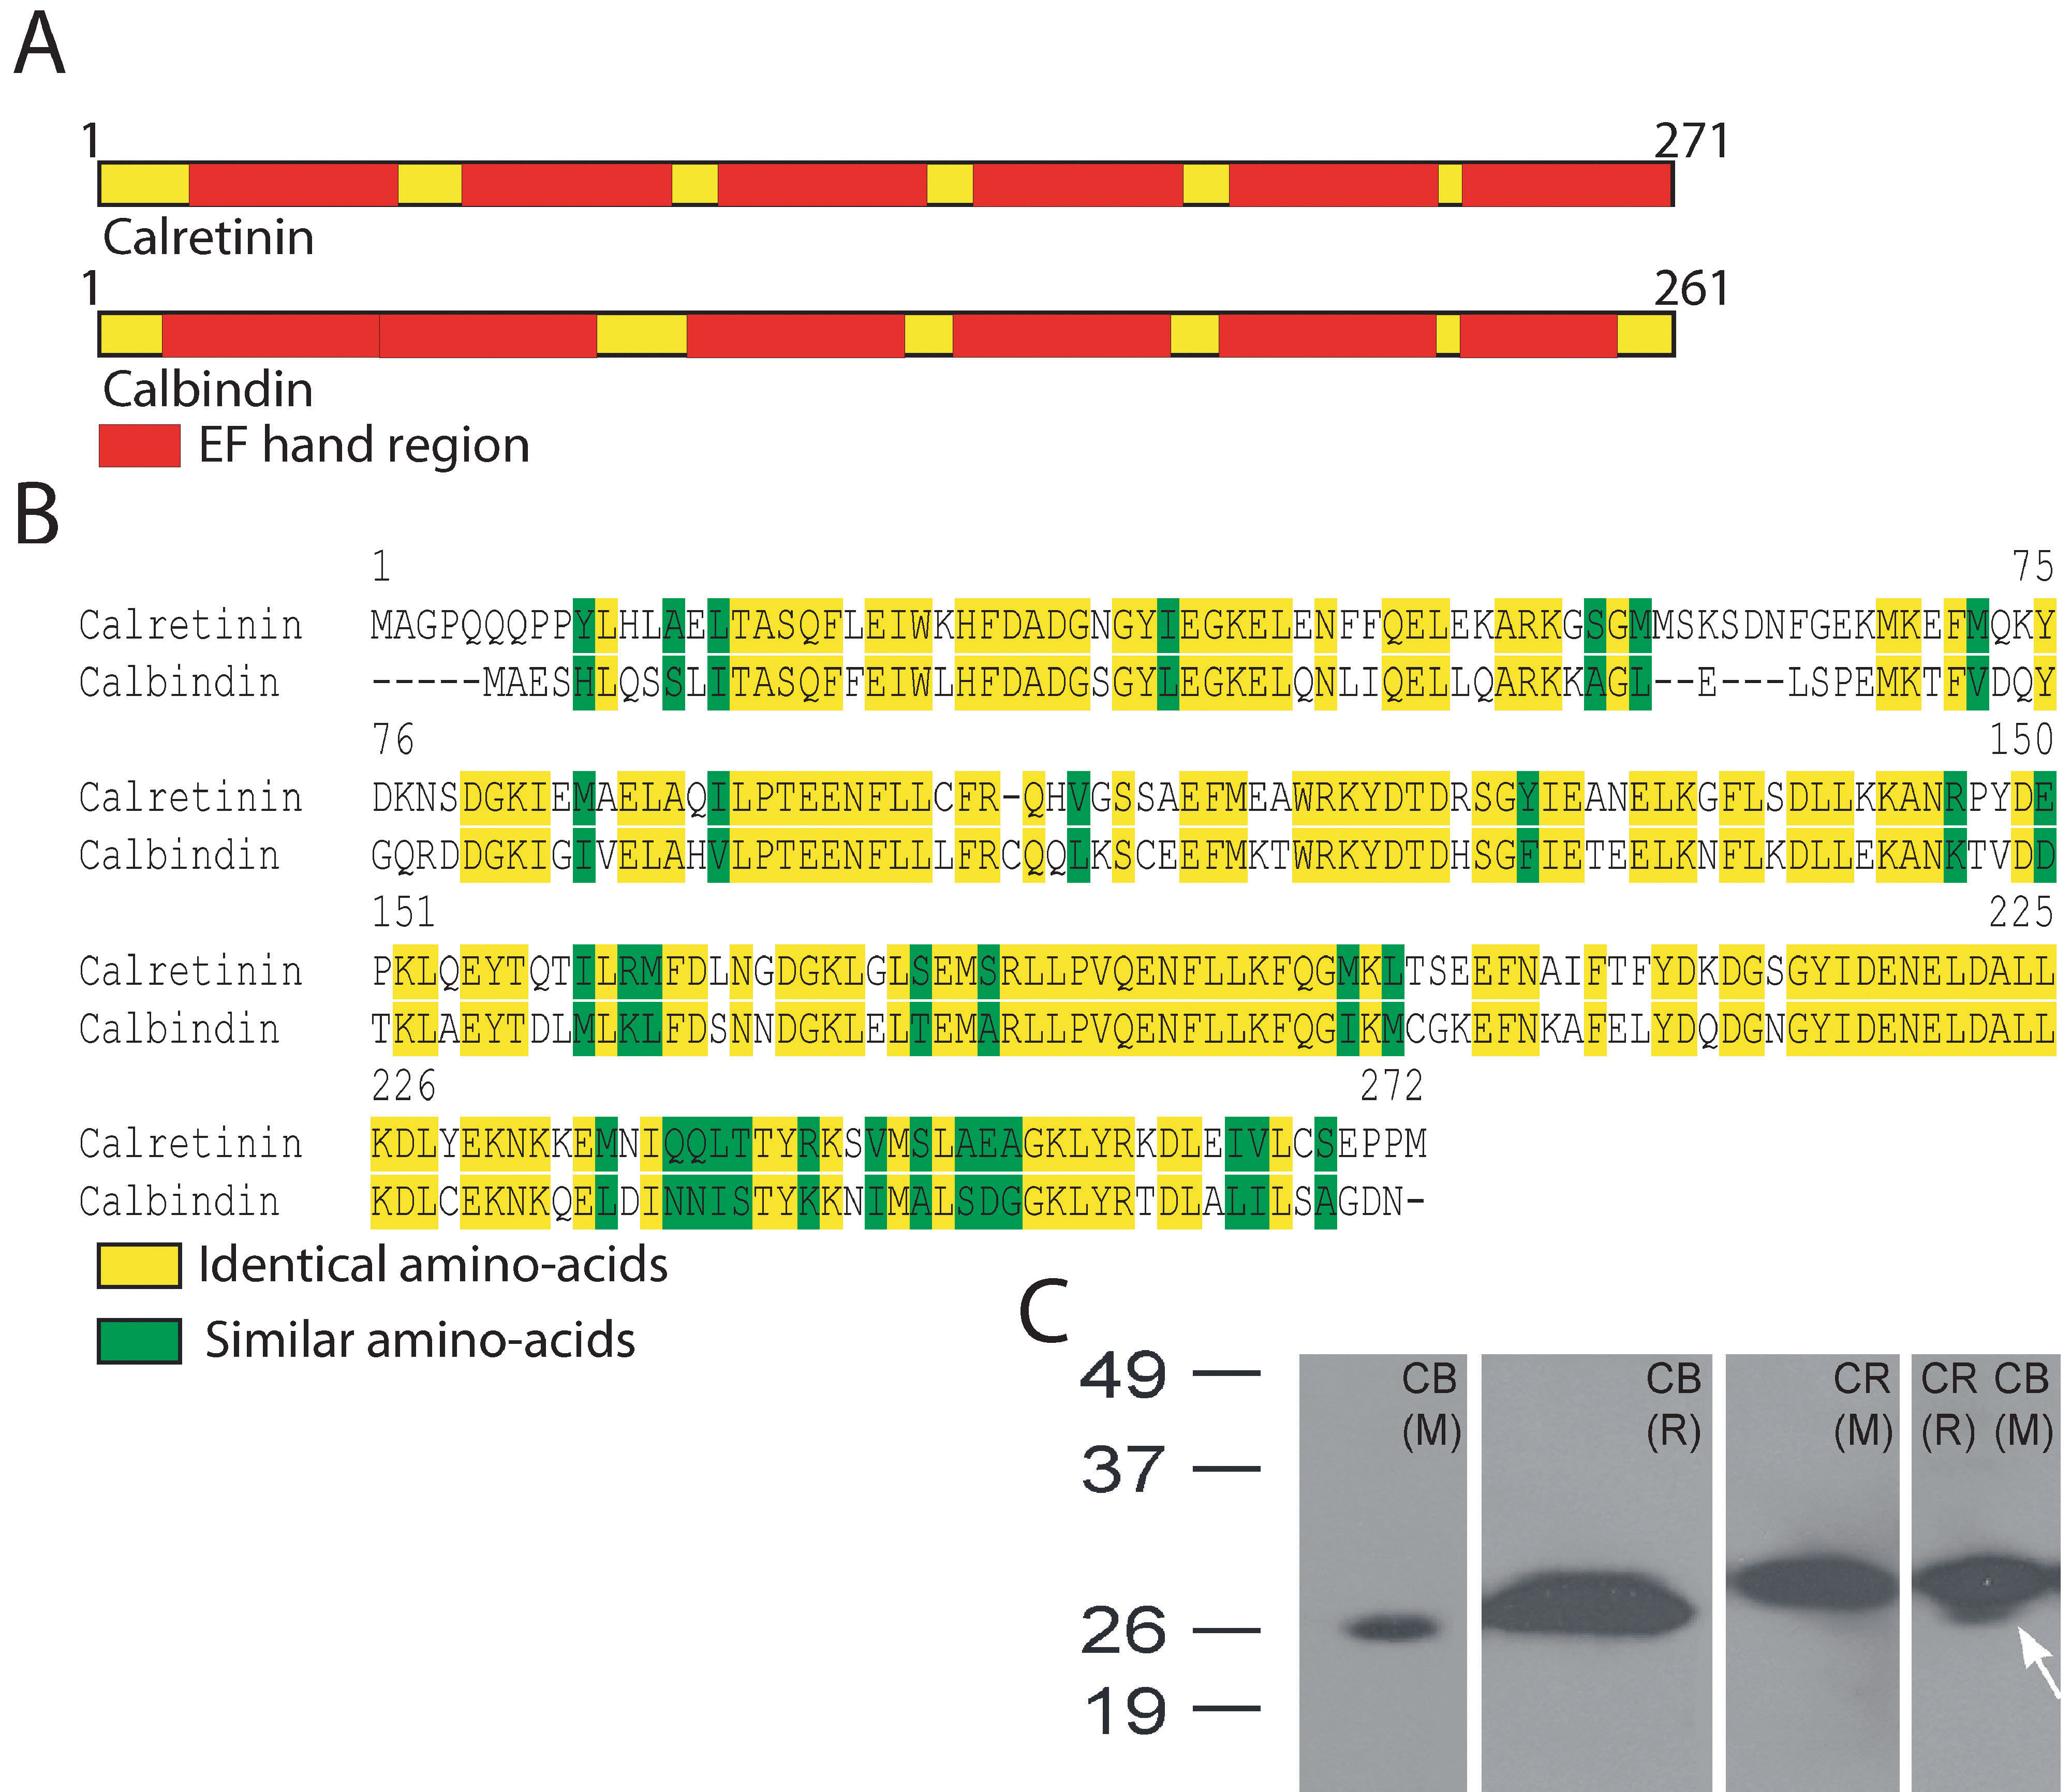
Figure 1. Schematic representation of
calretinin and calbindin-28 kDa proteins and their sequence identity.
A:
Shown is a schematic representation of calretinin and calbindin-28 kDa
proteins. The red blocks mark the E-helix-loop-F-helix-hand (EF) hand
regions within each molecule.
B: Alignment of the amino acid
sequences of rat calretinin and calbindin-28 kDa molecules is based on
NCBI accession numbers
P47728
and
P07171
respectively. Protein sequences were obtained from the NCBI protein
database.
C: Western blots for different calbindin-28 kDa (CB)
and calretinin (CR) antibodies for rabbit (R) and mouse (M) are shown.
Both calbindin-28 kDa and calretinin antibodies recognized a single
protein band close to 26 kDa. The blot on the far right used antibodies
for both calretinin (AB148) and calbindin-28 kDa (300). The arrow
indicates the putative calbindin-28 kDa-positive band below the thicker
calretinin positive band.