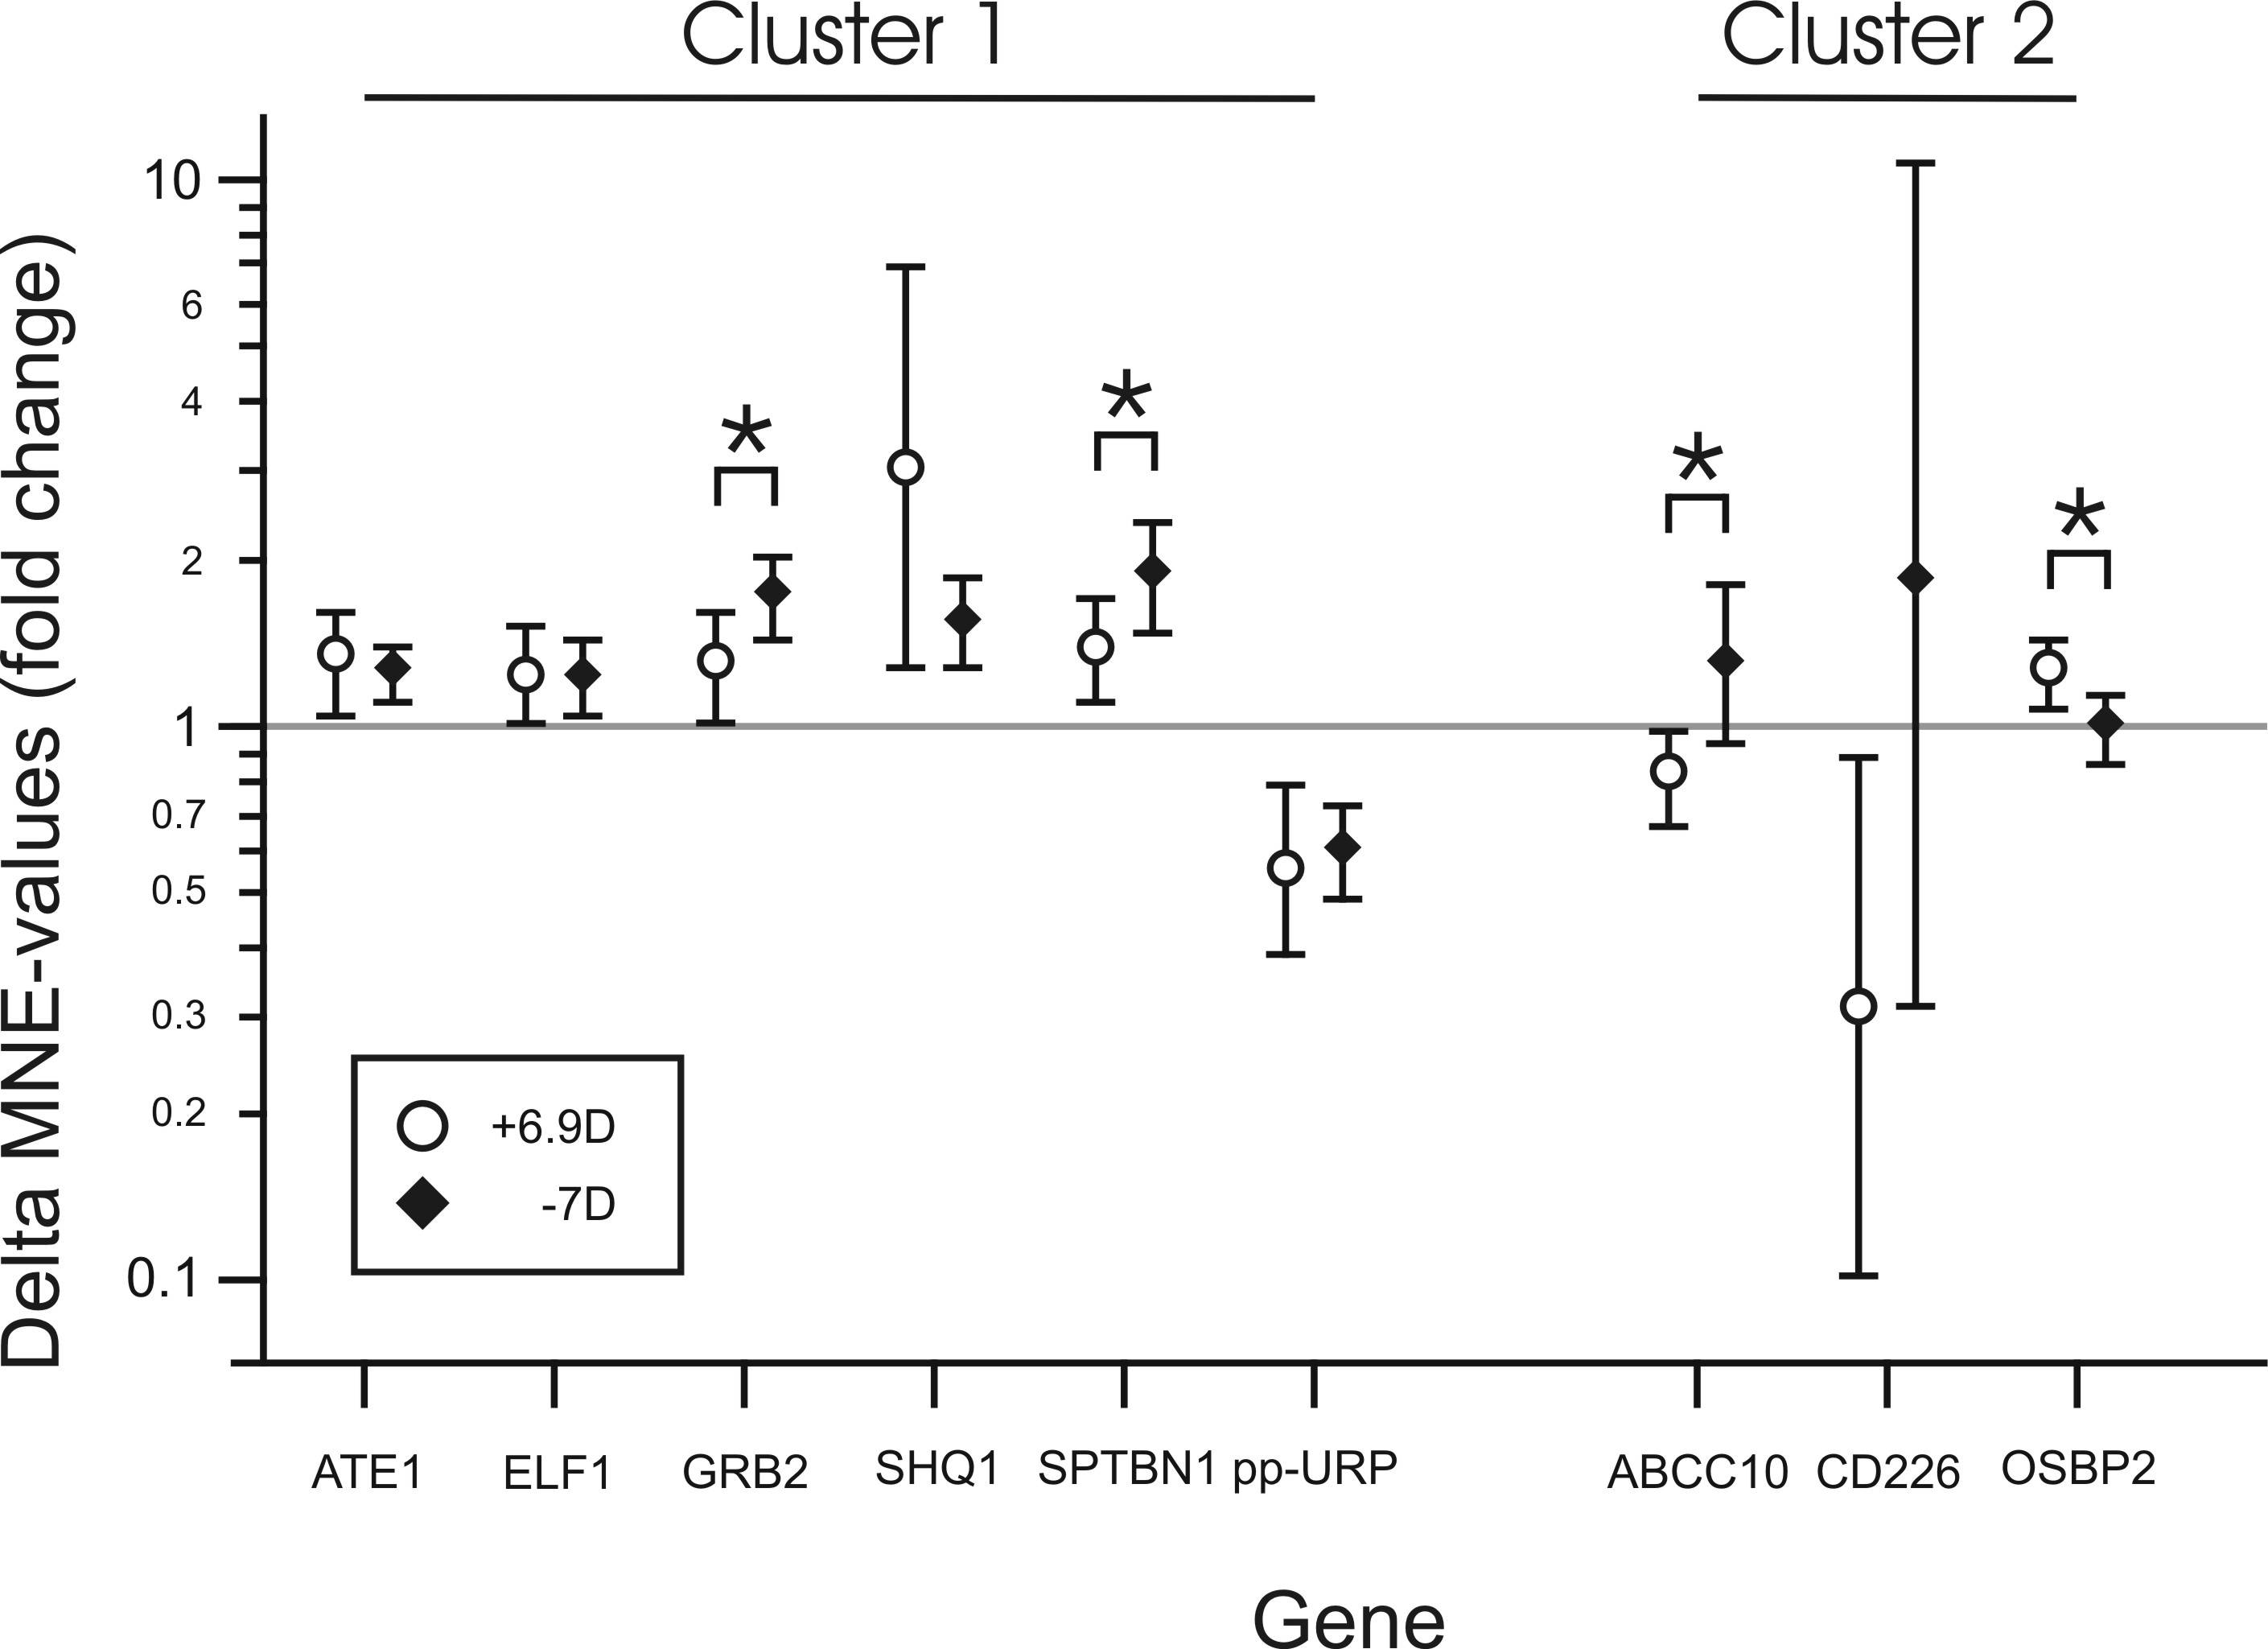
Figure 1. Results of the real-time PCR
experiment. The mean differences in gene expression (shown as delta
Mean Normalized Expression values, deltaMNE) and their 95% confidence
intervals between the lens-treated groups (24 h treatment with +6.9D
and −7D lenses, respectively) and the untreated control groups (n=6
animals each) are shown for the nine genes for which the microarray
data could be confirmed. The horizontal gray line at fold change 1
indicates no change. Asterisks denote significant differences
(p<0.05) between the two groups. Unpaired t-tests were
performed, and not corrected for multiple testing. Genes were assigned
to clusters depending on the directions of the changes (Cluster 1:
changes in the same direction under both conditions; Cluster 2: only
regulated in response to positive lens treatment).