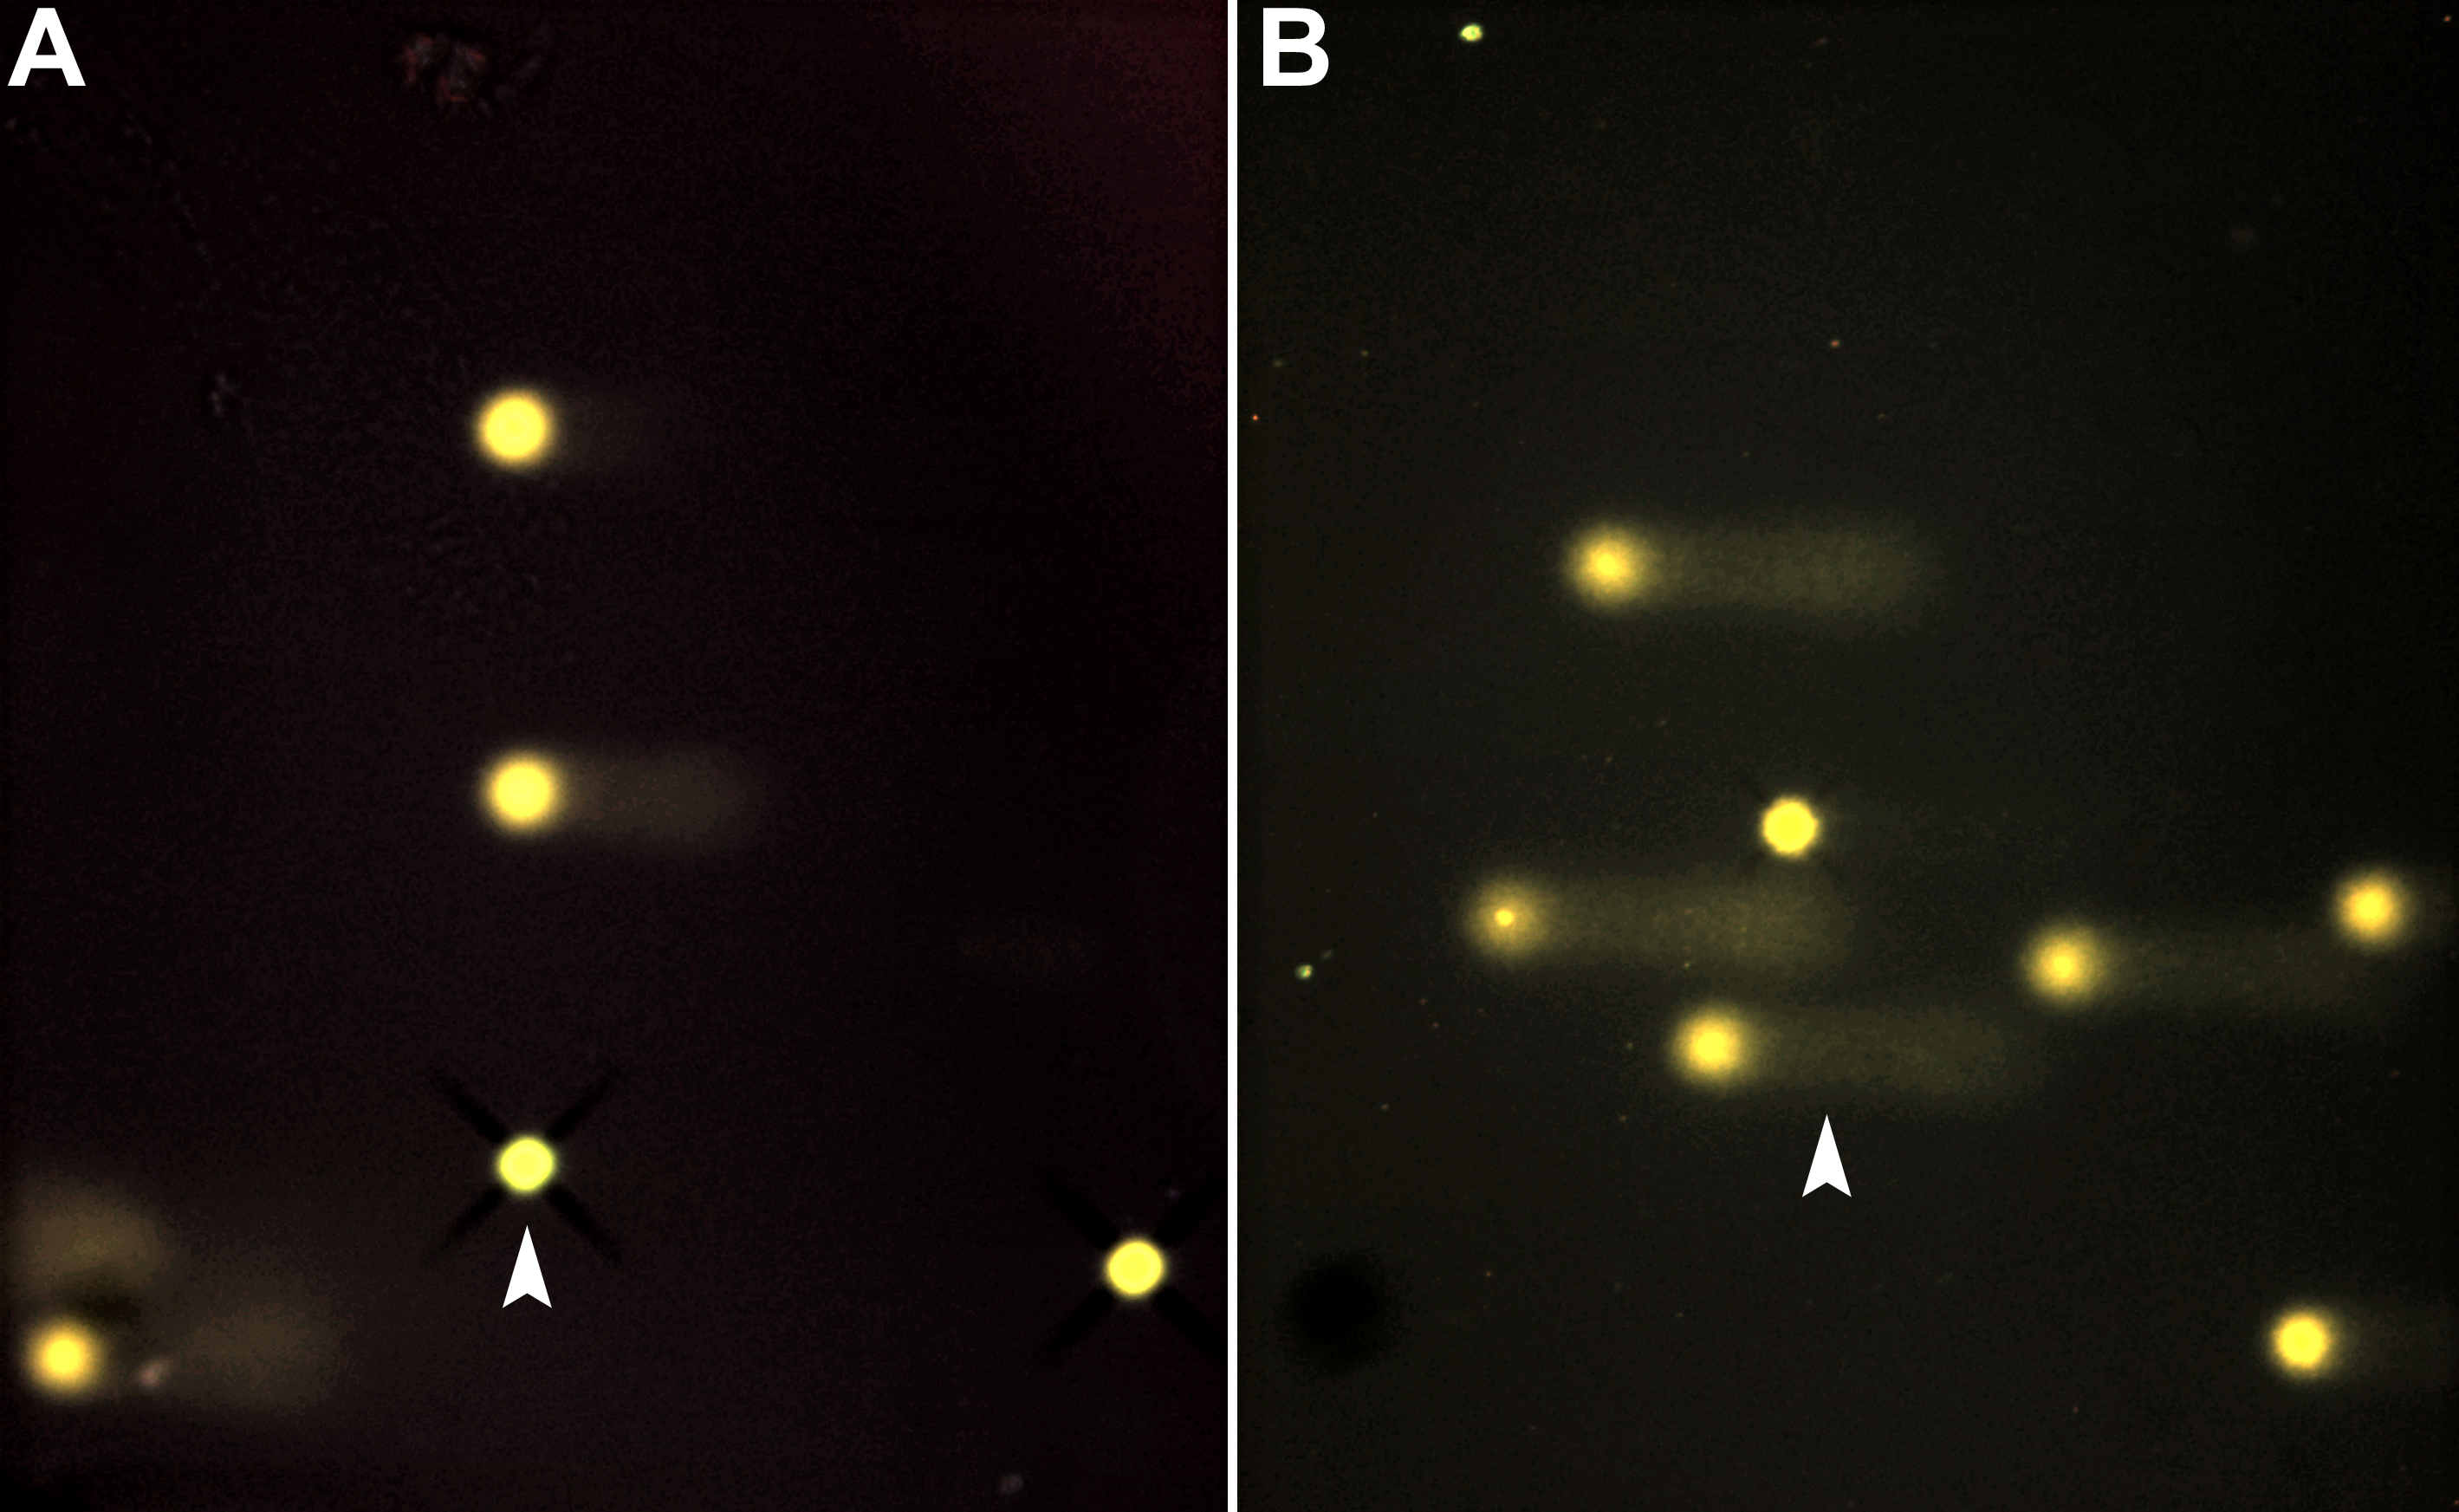
Figure 1. Photographs of cells analyzed by
comet assay analysis. This figure shows photographs taken from the
comet assay analysis. Each spot represents the DNA of an individual
cell. The “dark/white” round spot represents the intact DNA. Intact DNA
is a large molecule that does not migrate much in the electrophoretic
field. The less dark “comet shaped” area adjacent to the nucleus
represents DNA breaks that are small enough to move in the gel. The
arrow in A points toward a virtually intact cell whereas the
arrow in B points toward a cell with a large “comet”, which is
indicative of a large amount of DNA breaks.