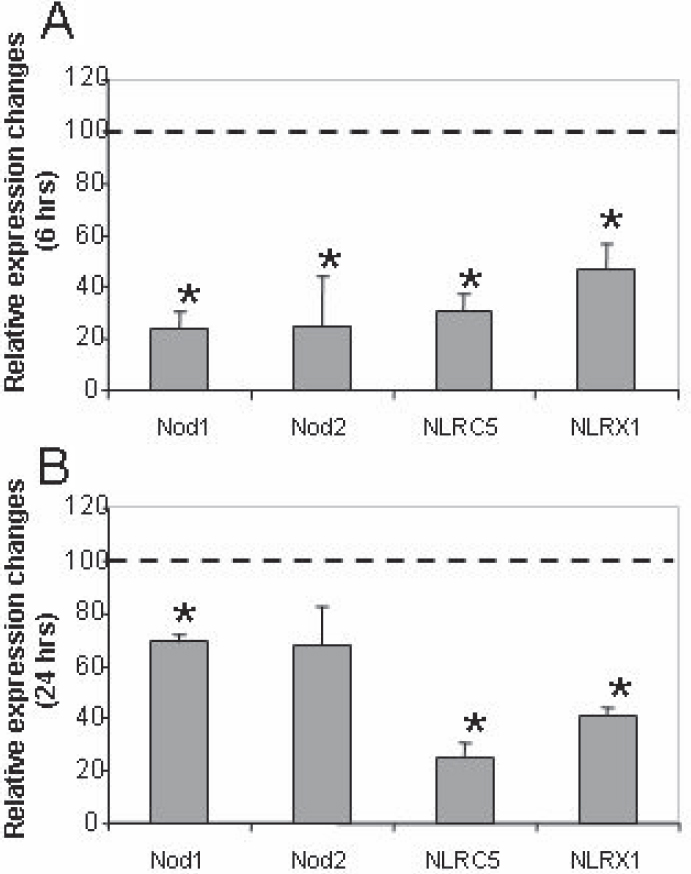
Figure 6. The effect of UV-B treatment on
the expression of Nod subtypes in HCE-T cells. Changes of
Nod
mRNA expression 6 h (
A) or 24 h (
B) after UV-B treatment
are shown. The relative expression of
Nod1,
Nod2,
Nod4/Nod27,
and
Nod5/Nod9 was measured in 85%–90% confluent HCE-T cells
irradiated with 30 mJ/cm
2 UV-B as described in the legend of
Figure 1
and is shown as compared to cells incubated in the same way but not
irradiated. Mean values and ±SD were calculated from six independent
measurements. The asterisk indicates a p<0.005.