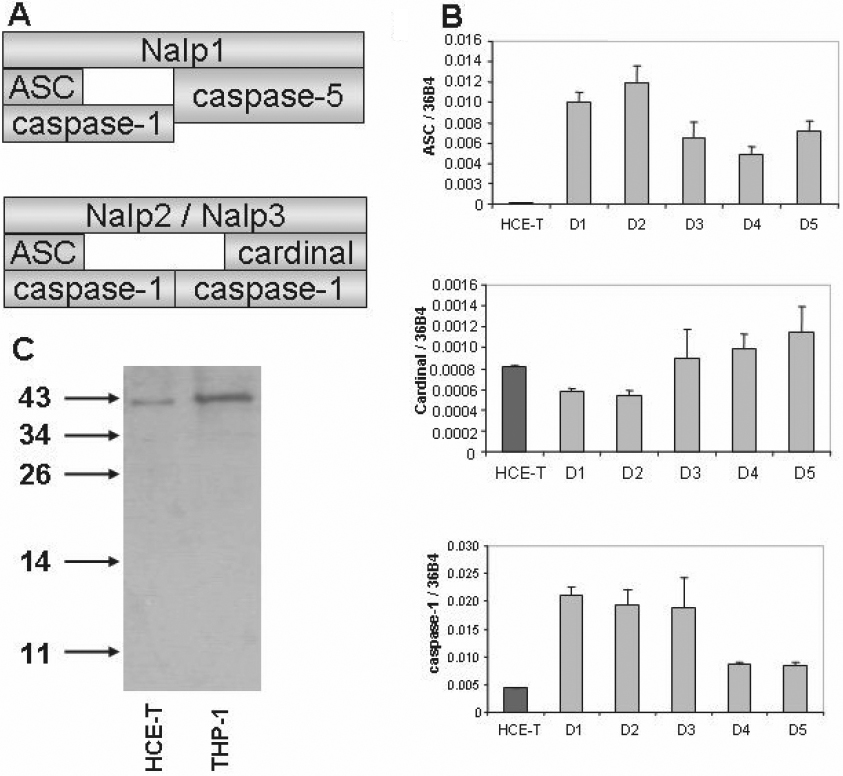
Figure 2. Transcription of inflammasome
adaptors and enzymes. The relative expression of adaptors and caspase
mRNA was measured by real time RT–PCR in HCE-T cells and in primary
corneal epithelial cells derived from five individuals referred to as
donors (D1 – D5) as described in Methods. A: Composition of the
Nalp1 and Nalp2/Nalp3 inflammasomes is diagrammed. B: Relative
expression levels of Nalp-inflammasome adaptors and enzymes in HCE-T
cells (mean values of three independent experiments) and in PRK samples
are shown in charts. Relative gene expression is shown as the ratio of
the indicated transcripts relative to 36B4 expression±SD
measured in triplicates. C: Detection of caspase-1 protein
expression of HCE-T and THP-1 cell lysates by western blotting is
illustrated.