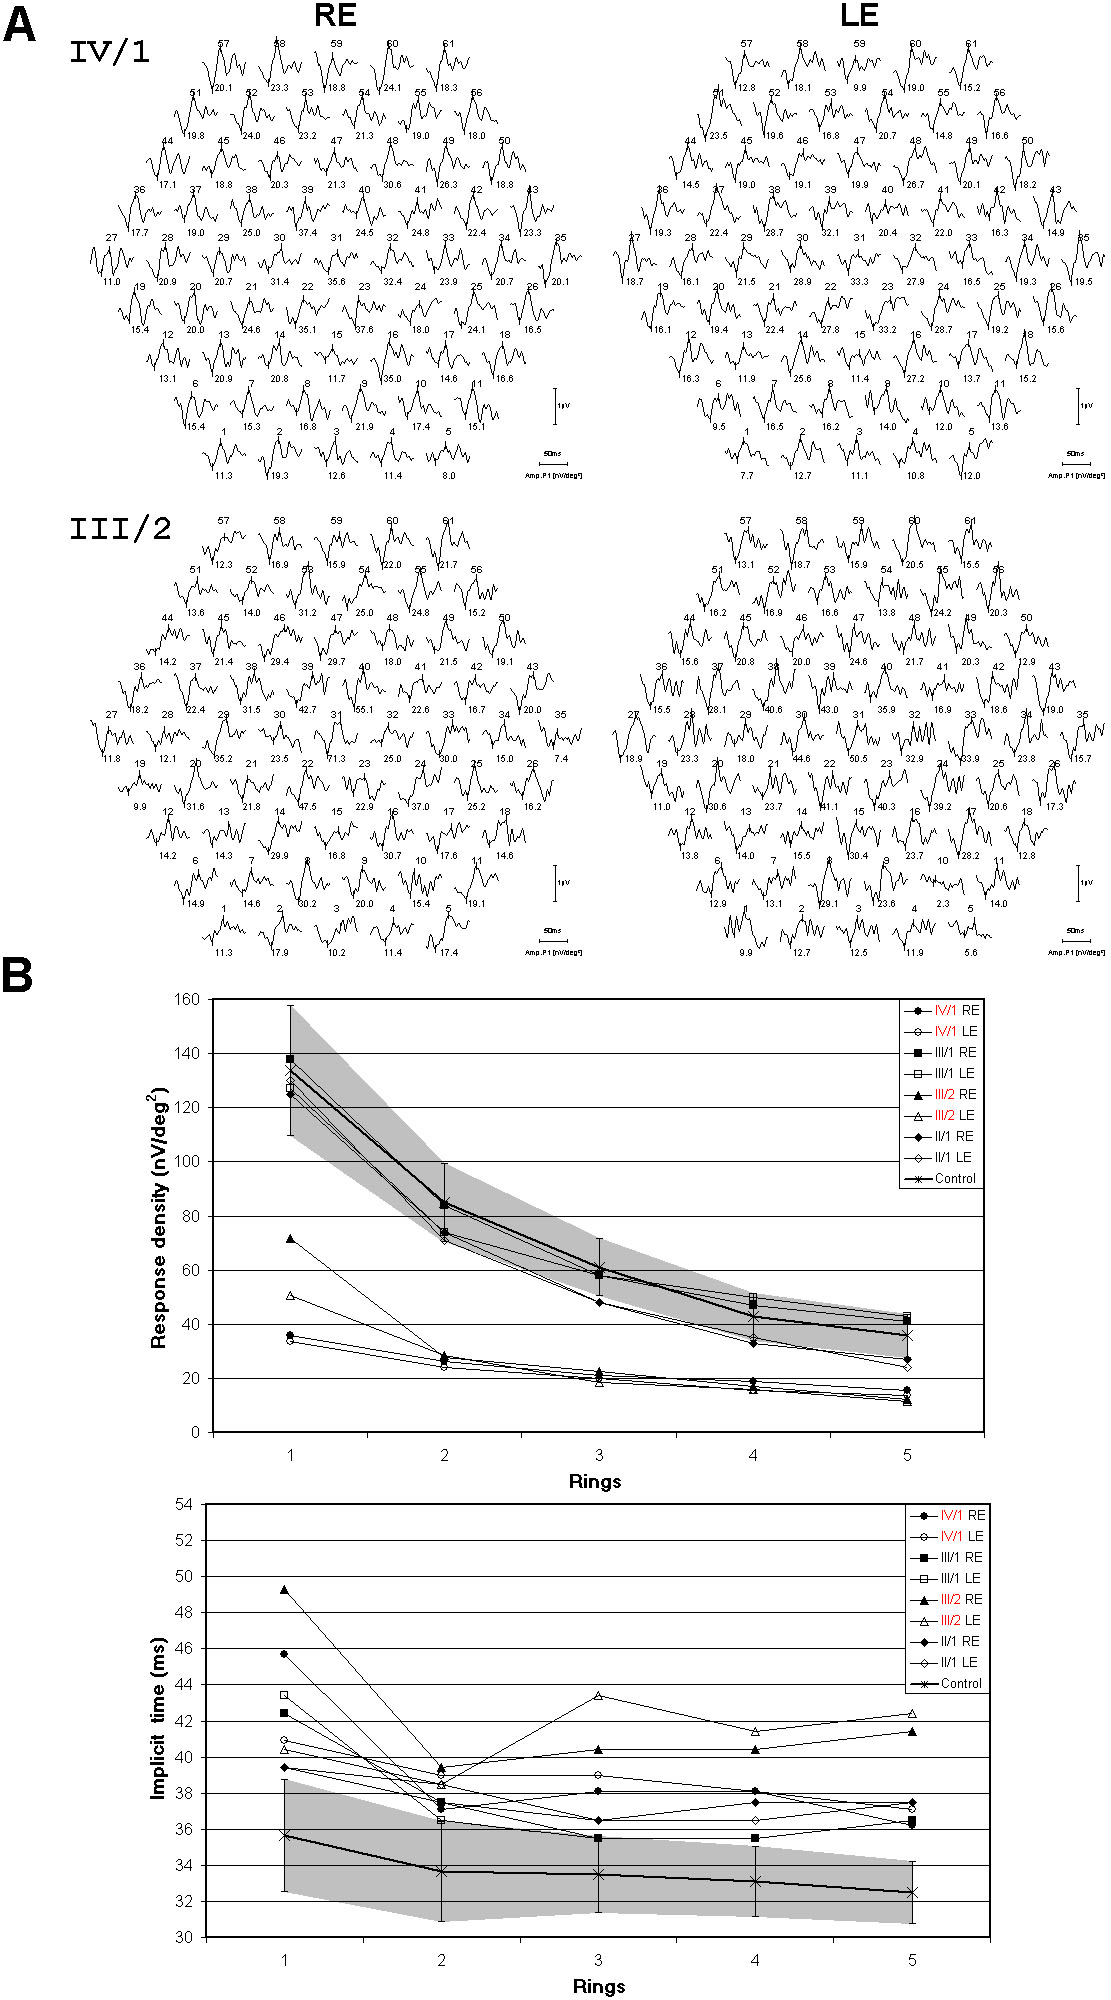
Figure 4. Multifocal electroretinography
results of the two patients, carriers, and controls. A: Trace
arrays of patients IV/1 and III/2 with 61 elements. B: Response
densities (RDs) and implicit times of multifocal electroretinographs
for five eccentric rings in patients (marked red), carriers, and
controls. Gray area represents the 95% confidence interval of our
control database, the single control line in the center of the gray
area represents the average of the set of control patients, while error
bars represents ± standard deviation (SD). Response densities (RDs) of
patients were decreased in all rings, while carriers’ RDs were within
the normal range. Implicit times of patients and carriers were delayed
in all rings. The following abbreviations were used: right eye (RE) and
left eye (LE).