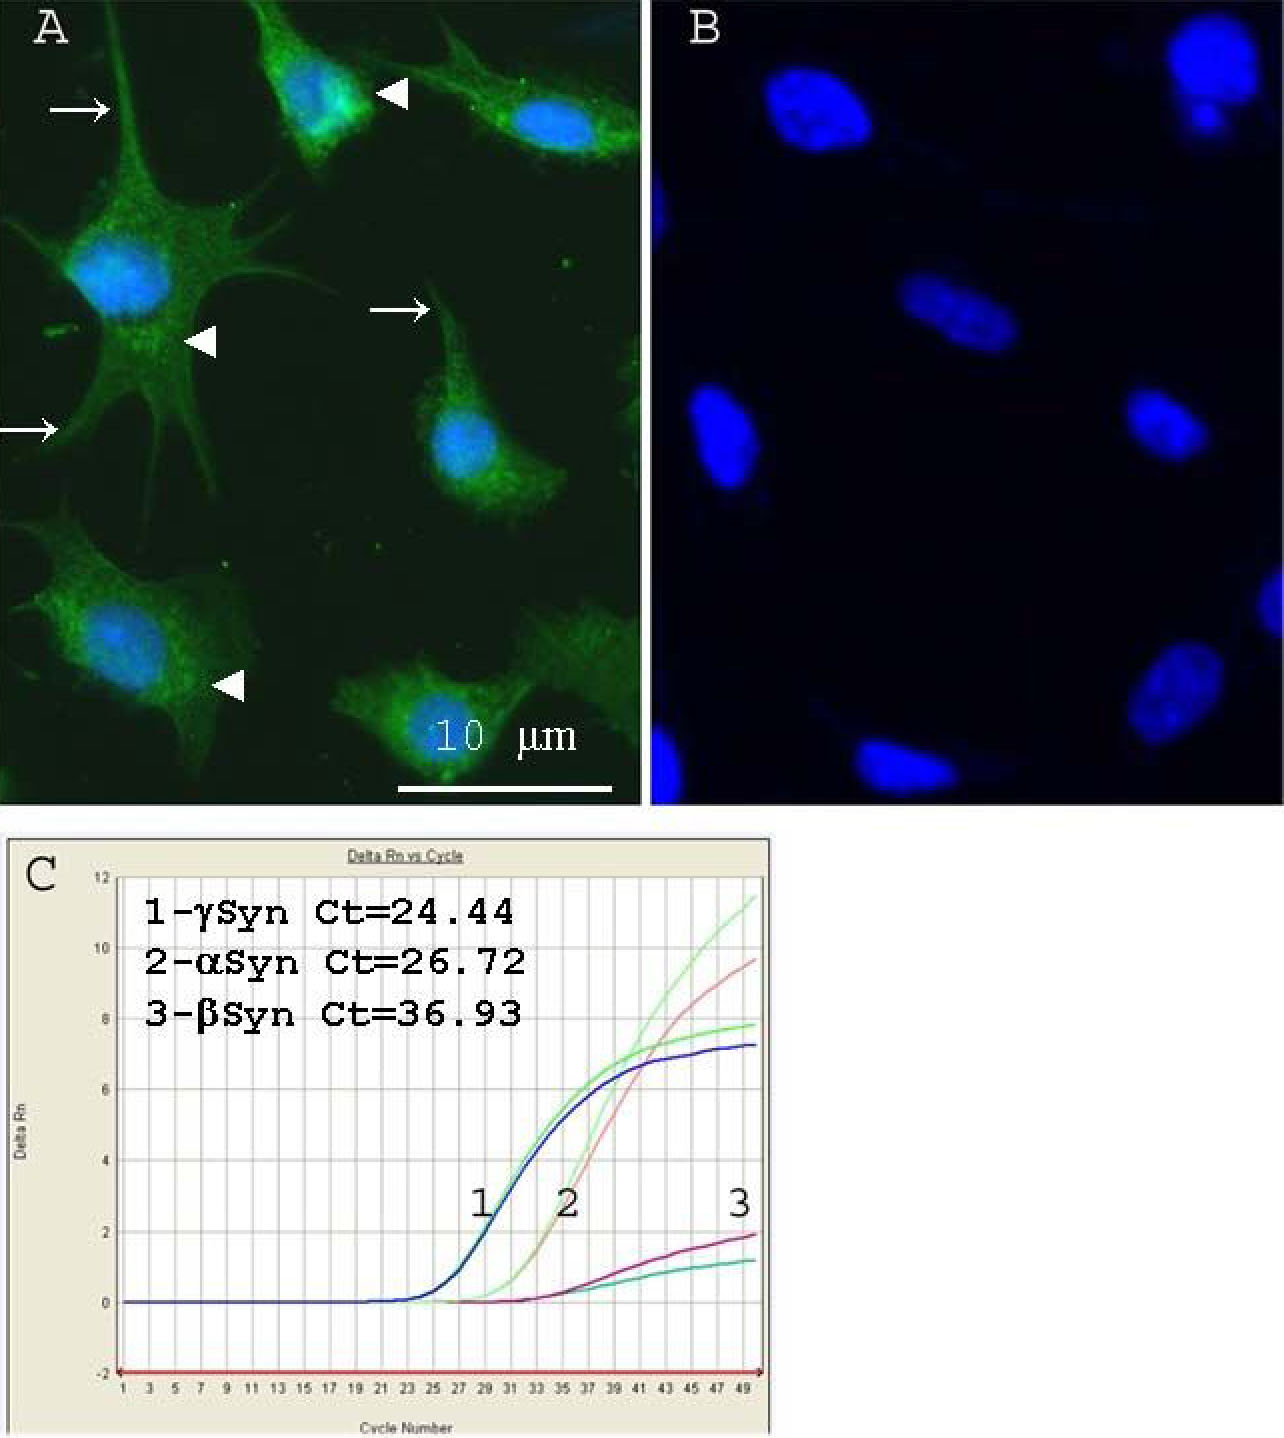
Figure 4. Retinal ganglion cell-5 (RGC-5)
cell-line expression of γ-synuclein protein and mRNA were investigated
using immunofluorescence and quantitative RT–PCR. A:
Immunofluorescent staining of RGC-5 cultures reveals γ-synuclein
staining (green) localized in the perinuclear area (arrowheads) and in
cell processes (arrows). B: no fluorescence was detected in the
absence of primary antibody.Nuclei were counterstained with DAPI
(blue). C:qRT–PCR of endogenous synuclein-family
transcripts in RGC-5 demonstrates that γ-Synuclein had the highest
level of expression (Ct=24.44±0.3), followed by α-synuclein
(Ct=26.72±0.3) and finally β-synuclein (Ct=36.93±0.4). Ct represents
threshold cycles; a lower number reflects higher levels of initial
mRNA. A representative duplicate curves are shown for three independent
isolation. Ct differences were statistically significant (p<0.05).