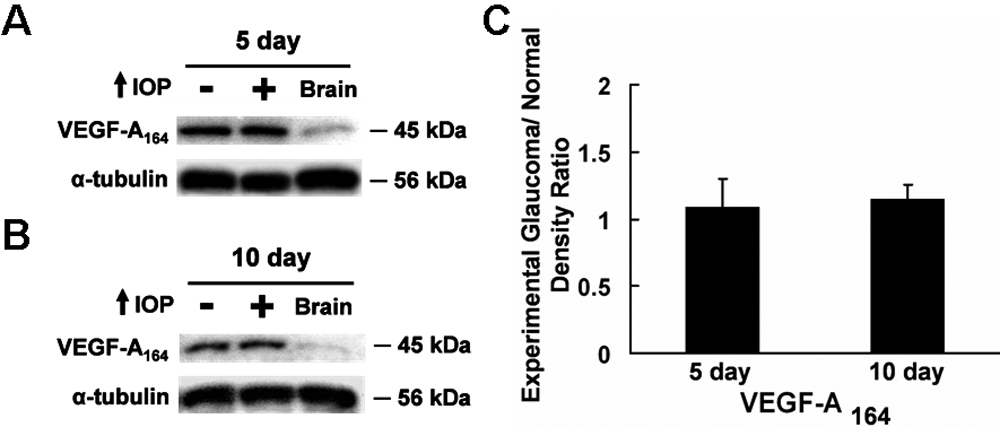
Figure 1. Western blot analysis of VEGF-A164
expression in the glaucomatous retina. A: VEGF-A164
was detected at 45 kDa in control and glaucomatous retinas after five
days of elevated IOP. B: Similarly, VEGF-A164 was
observed at 45 kDa in the control and glaucomatous retinas following 10
days of elevated IOP. C: Glaucomatous/control ratio of
normalized VEGF-A164 densitometry readings in the retina is
demonstrated in the chart. VEGF-A164 was expressed at
comparable levels in the control and glaucomatous retinas after five
and 10 days of elevated IOP. The positive control was the brain, and
the loading control was α-tubulin.