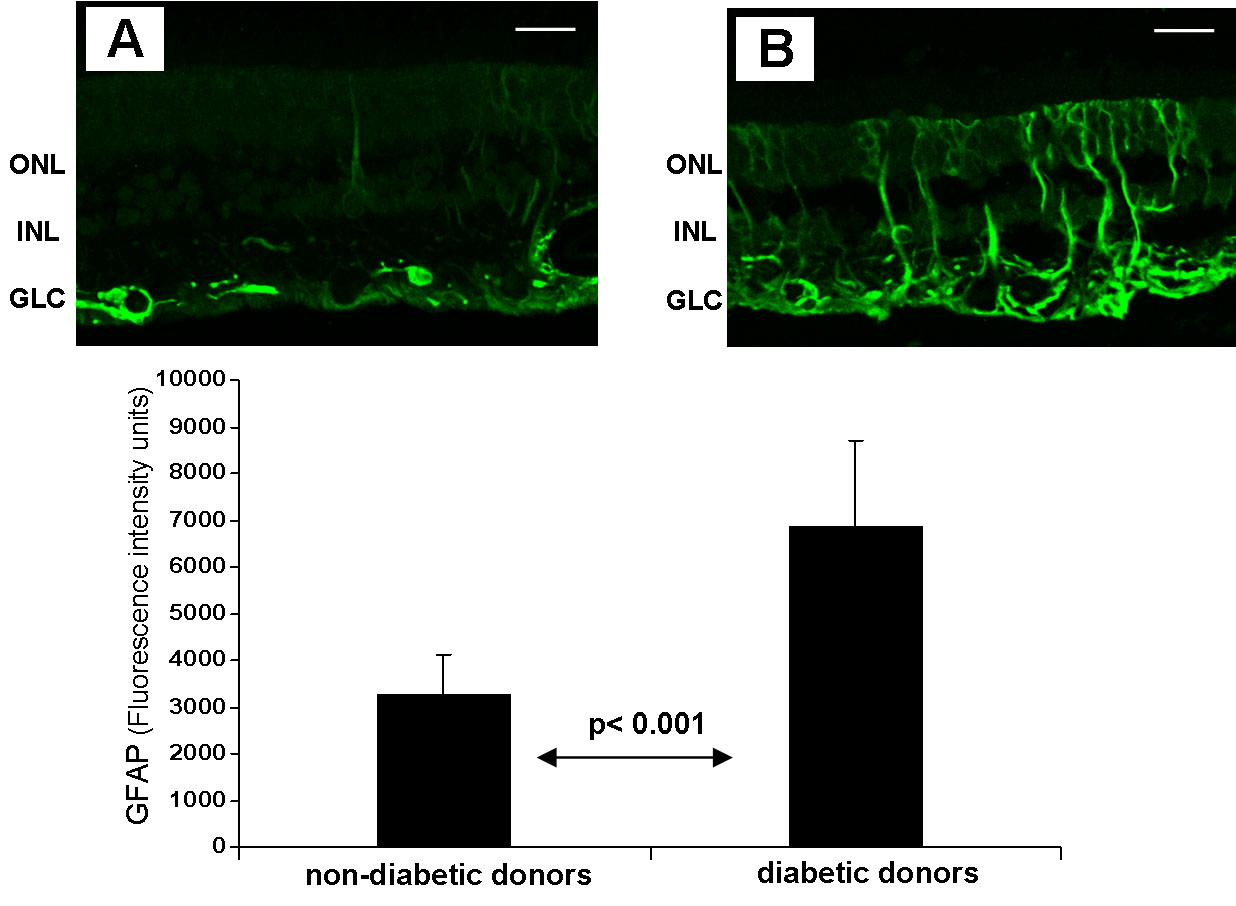
Figure 4. A comparison of glial fibrillar
acidic protein ( GFAP) immunofluorescence between diabetic and
nondiabetic donors. The upper panel shows images of representative
samples of retina from a non-diabetic donor (A) and a diabetic
donor (B). In the diabetic retina, the endfeet of the Müller
cells showed abundant GFAP immunofluorescence (green), and the radial
processed stained intensely throughout both the inner and the outer
retina. The lower panel shows the quantification of GFAP
immunofluorescence in non-diabetic and diabetic retinas. The following
abbreviations are used in the figure: outer nuclear layer (ONL); inner
nuclear layer (INL); and ganglion cell layer (GCL). The bar represents
20 μm.