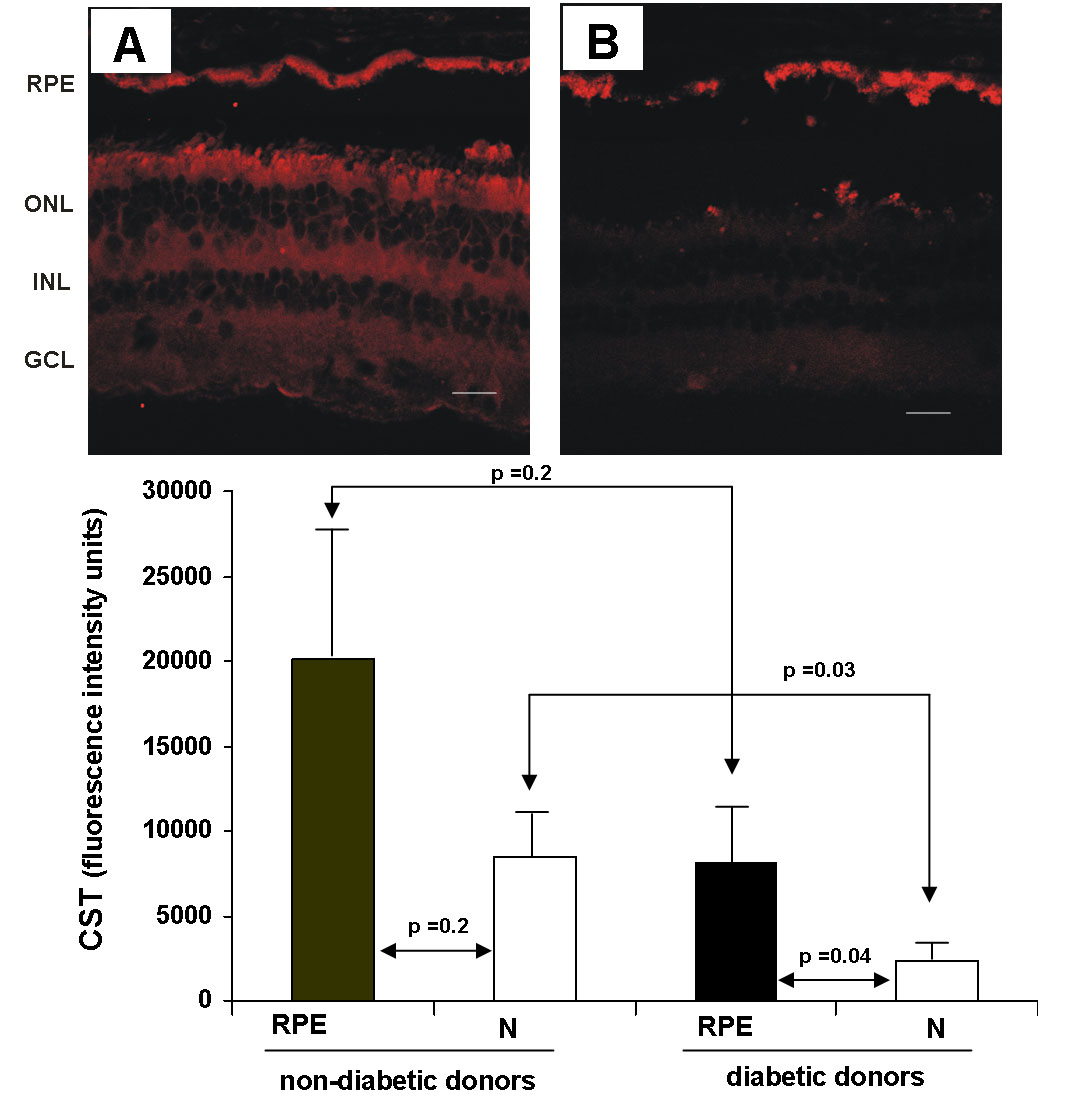
Figure 2. A comparison of protein content
of CST in the retina from diabetic and nondiabetic donors. The upper
panel shows a comparison of CST-29 immunofluorescence (red) in the
human retina between representative samples from a non diabetic donor (A)
and a diabetic donor (B). The bar represents 20 μm. Lower panel:
quantification of CST-29 immunofluorescence in non-diabetic and
diabetic retinas. The following abbreviations are used in the figure:
retinal pigment epithelium (RPE); outer nuclear layer (ONL); inner
nuclear layer (INL); and ganglion cell layer (GLC).