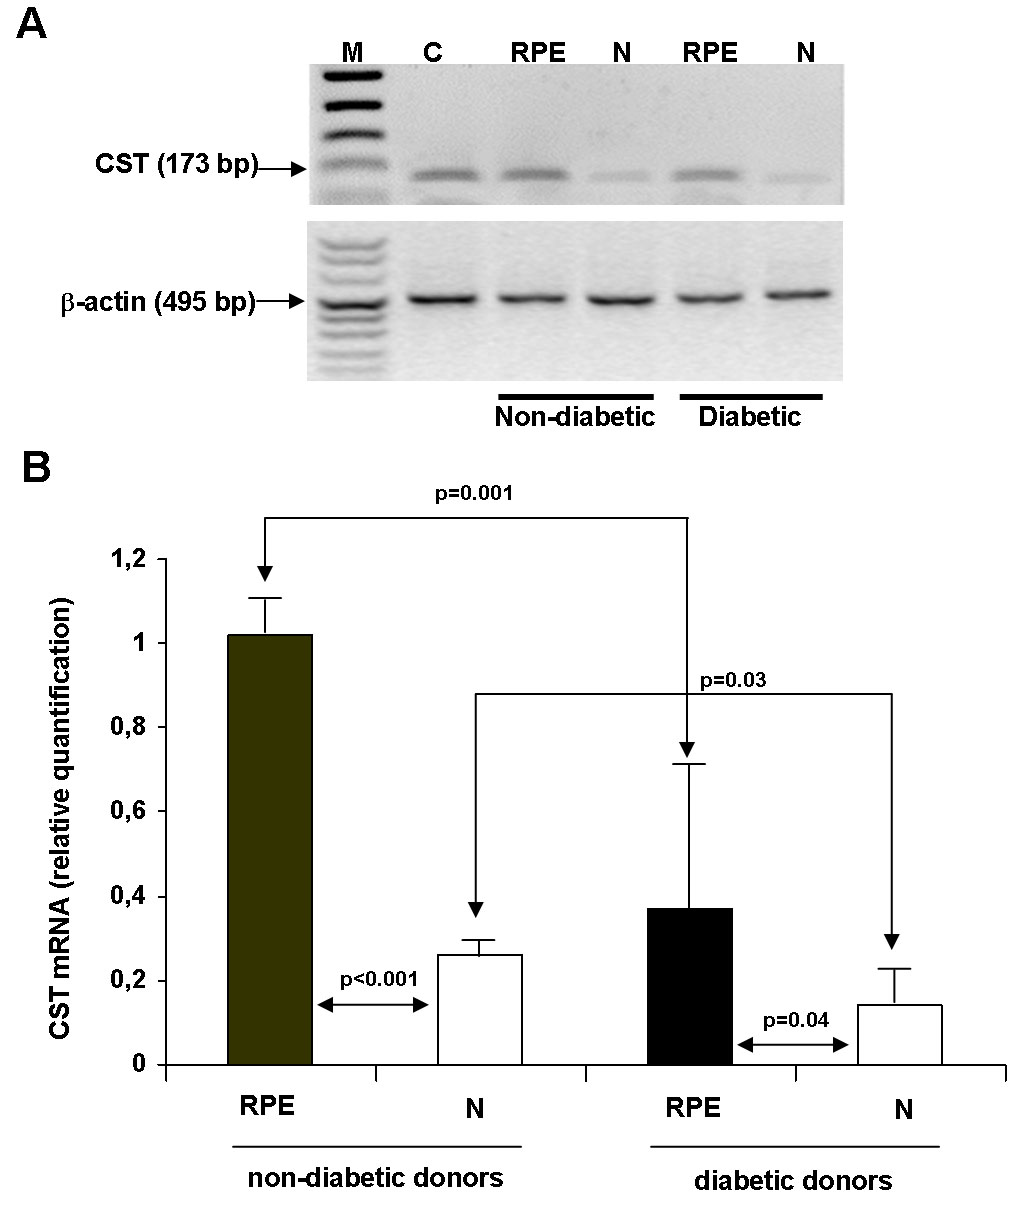
Figure 1. Expression of CST in the retinal
pigment epithelia (RPE) and in the neuroretina (N) of diabetic and
nondiabetic donors. A: Semiquantitative RT-PCR shows a higher
CST expression in the retina (RPE and N) from nondiabetic donors. Human
β-actin was used as internal control and, as can be seen, its signal
intensity was similar in the retina of diabetic and nondiabetic donors.
B: This shows real-time quantitative RT-PCR analysis of CST mRNA
in human retinas. The bars represent the mean±SD of the values obtained
in the five diabetic and the five nondiabetic donors studied. CST mRNA
gene expression was calculated after normalizing with β-actin. The
following abbreviations are used in the figure: size marker (M);
positive control, human brain (C); retinal pigment epithelium (RPE);
and neuroretina (N).