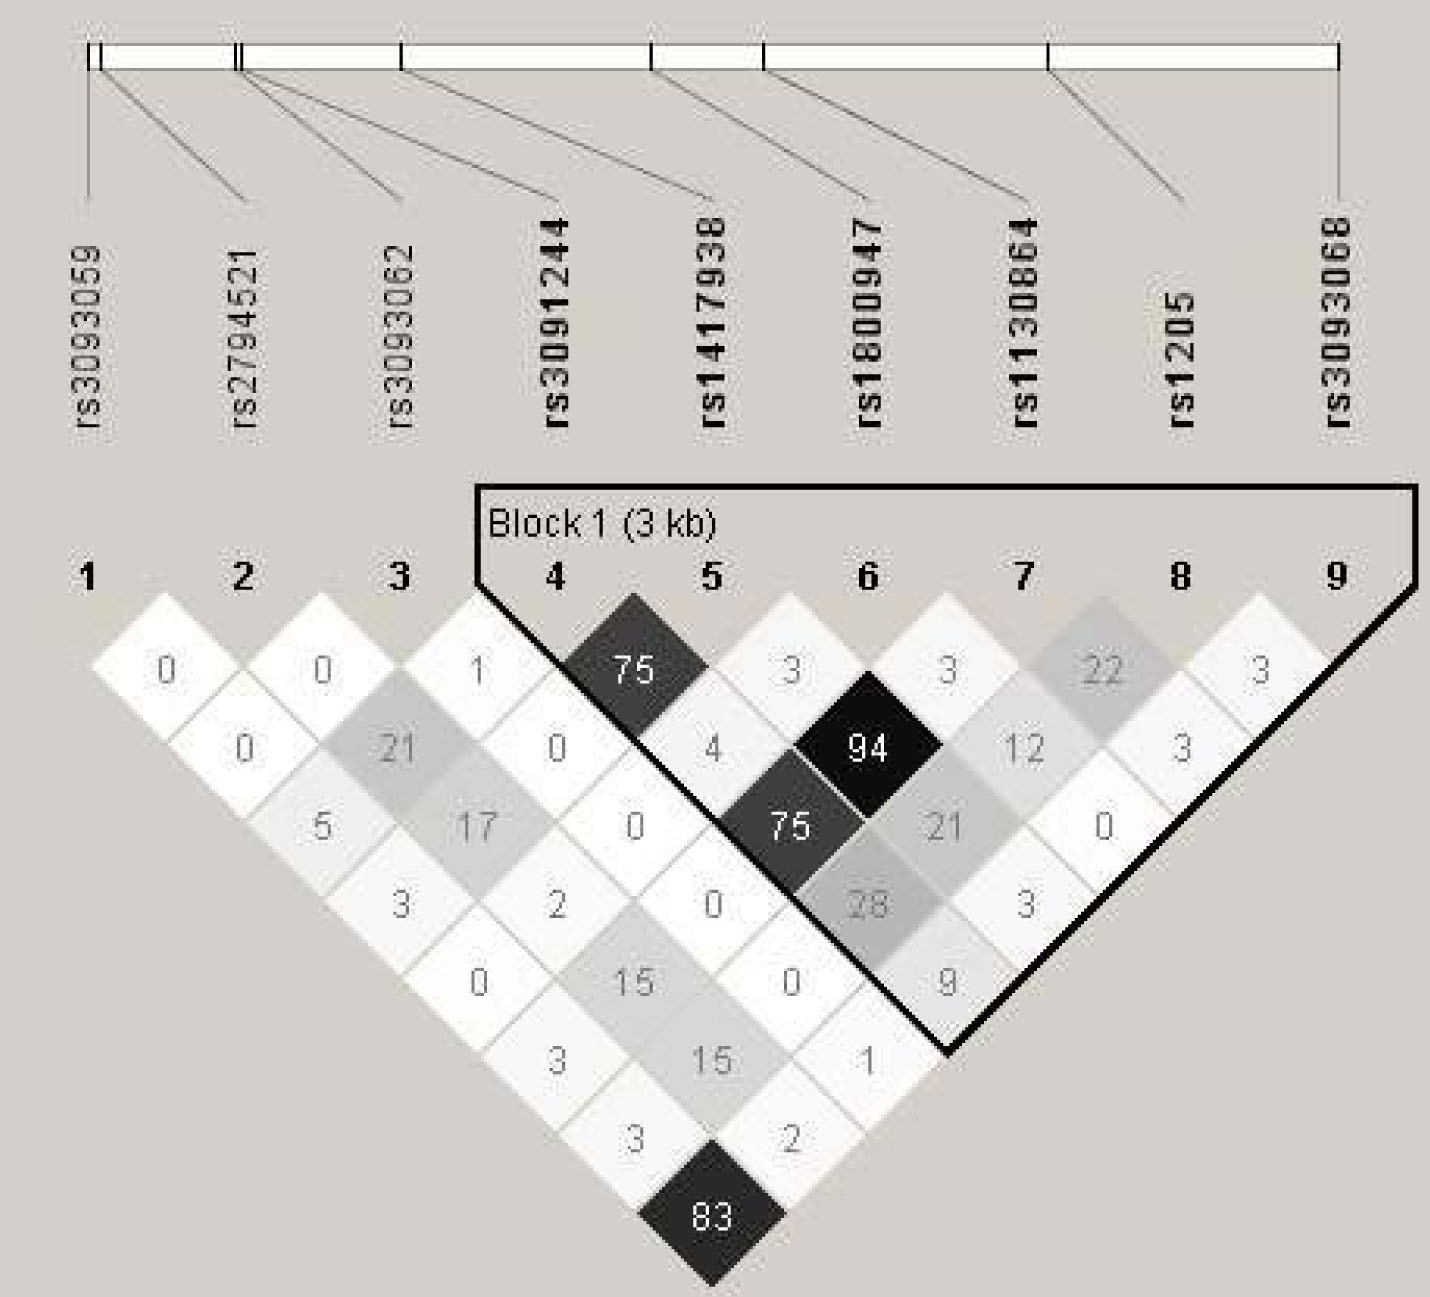
Figure 2. Linkage Disequilibrium of Single
Nucleotide Polymorphisms (SNPs) along the 1q25 region encompassing the
CRP gene and illustrating the 1 distinct haplotype block, defined by
the confidence intervals, an algorithm proposed by Gabriel et al. [
31] using HAPLOVIEW.
The linkage
disequilibrium (r
2) between any two SNPs is listed in the
cross cell. Asterisk means the darker the color indicates the higher
the linkage disequilibrium between any two SNPs. Please note that SNP
rs3091244
consists of three alleles; two minor alleles A and T are combined into
one minor allele due to the limitation of the program which only allows
for dichotomous SNPs. SNP
rs3093068
was genotyped on 205 subjects, whereas the other eight SNPs were
genotyped on 244 subjects.