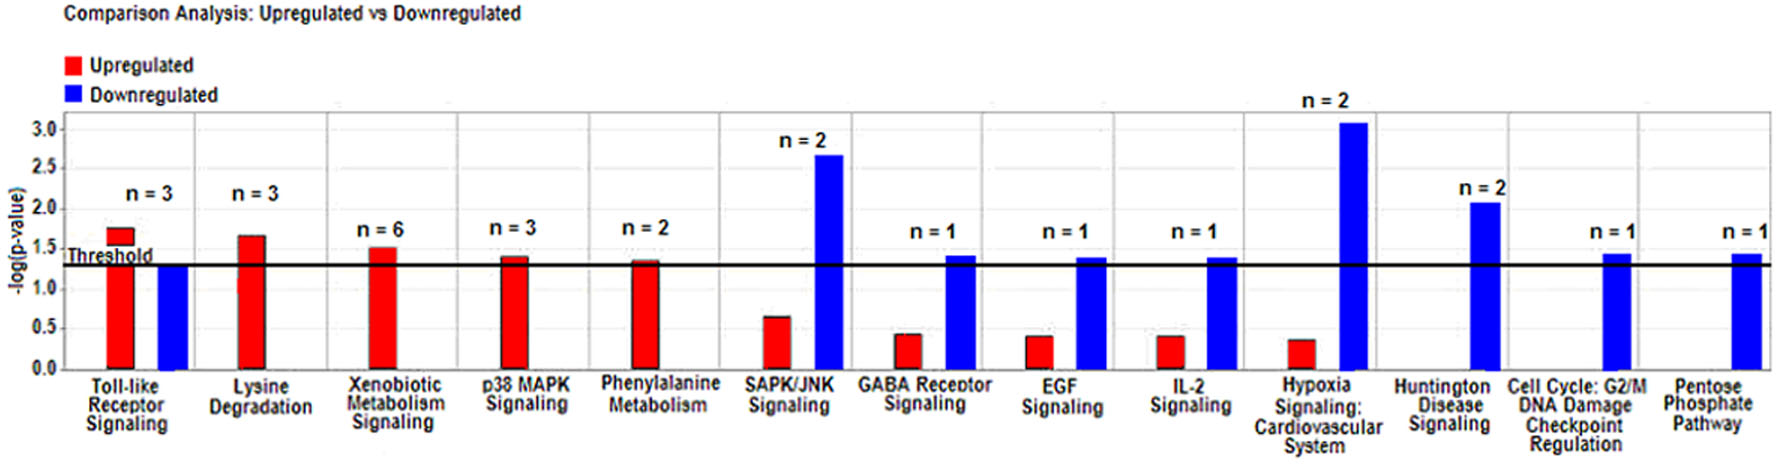
Figure 5. Global canonical pathway
analysis of significantly upregulated and downregulated genes in minus
lens-treated eyes as compared with plus lens-treated eyes. Data sets
were analyzed by the Ingenuity Pathways Analysis software (
Ingenuity® Systems).
The significance is expressed as a p value that is calculated using the
right tailed Fisher exact test. Red and blue bars represent
significantly upregulated and downregulated genes associated with
canonical pathways, respectively. In the figure, n represents the
number of genes identified in each of the pathways.