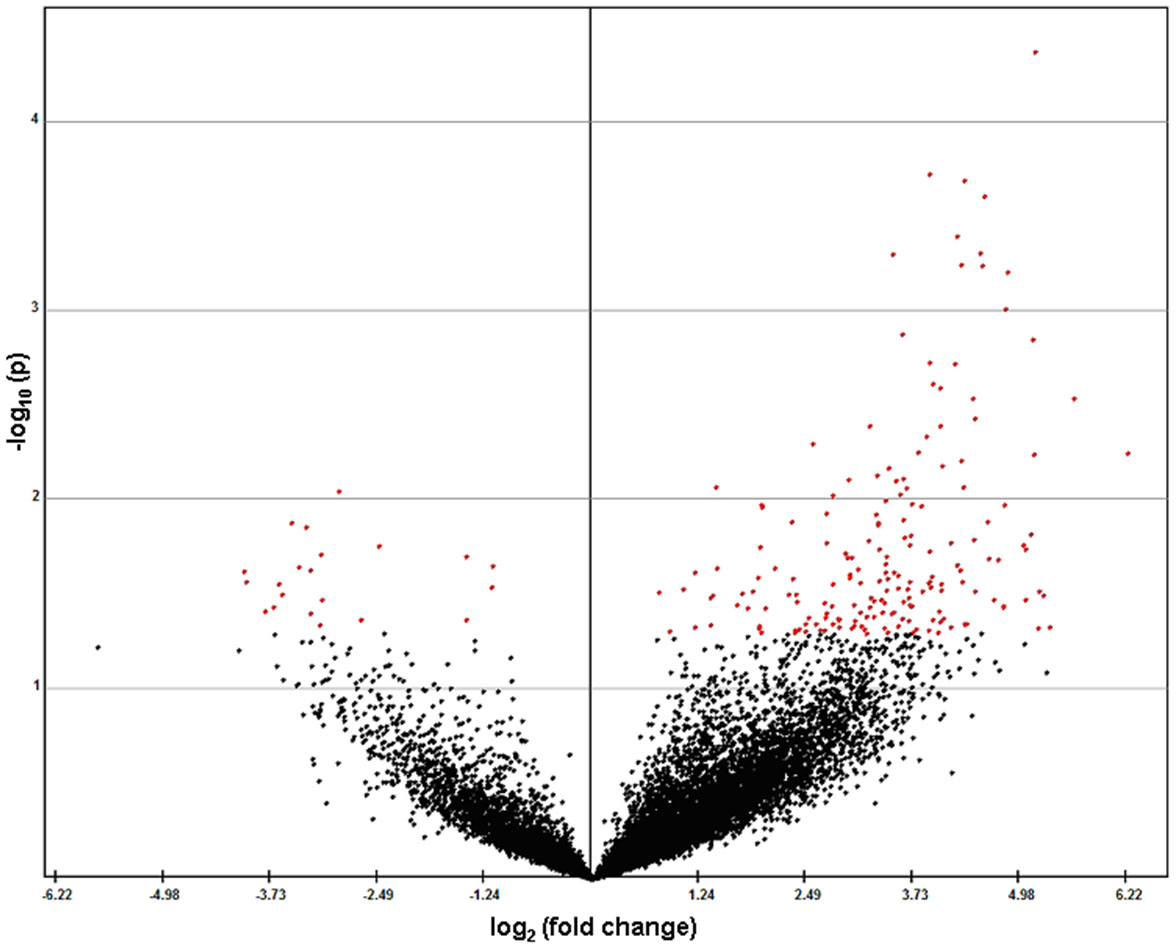
Figure 4. Volcano plot of marmoset
choroid/RPE microarray data. Scatter plot represents a summary of the t-tests
for the individual genes. For each gene this plot shows log2
of fold change between the mean expression in minus lens-treated group
and plus lens-treated group as plotted against −log10 (p),
where p is a probability value (for a given gene) which is associated
with the Student t-test comparison of the two groups of
samples. Using a p value of 0.05 as the cutoff threshold, 21 genes were
significantly downregulated in minus lens-treated eyes as compared with
plus lens-treated eyes (negative log2) and 183 genes were
significantly uppregulated in minus lens-treated eyes as compared with
plus lens-treated eyes (positive log2). Each point
represents an individual gene in the array; genes not significantly
altered are depicted in black, whereas genes significantly changed are
indicated in red. Those genes appearing on the upper left or right
region have a large fold-change and a smaller p value.