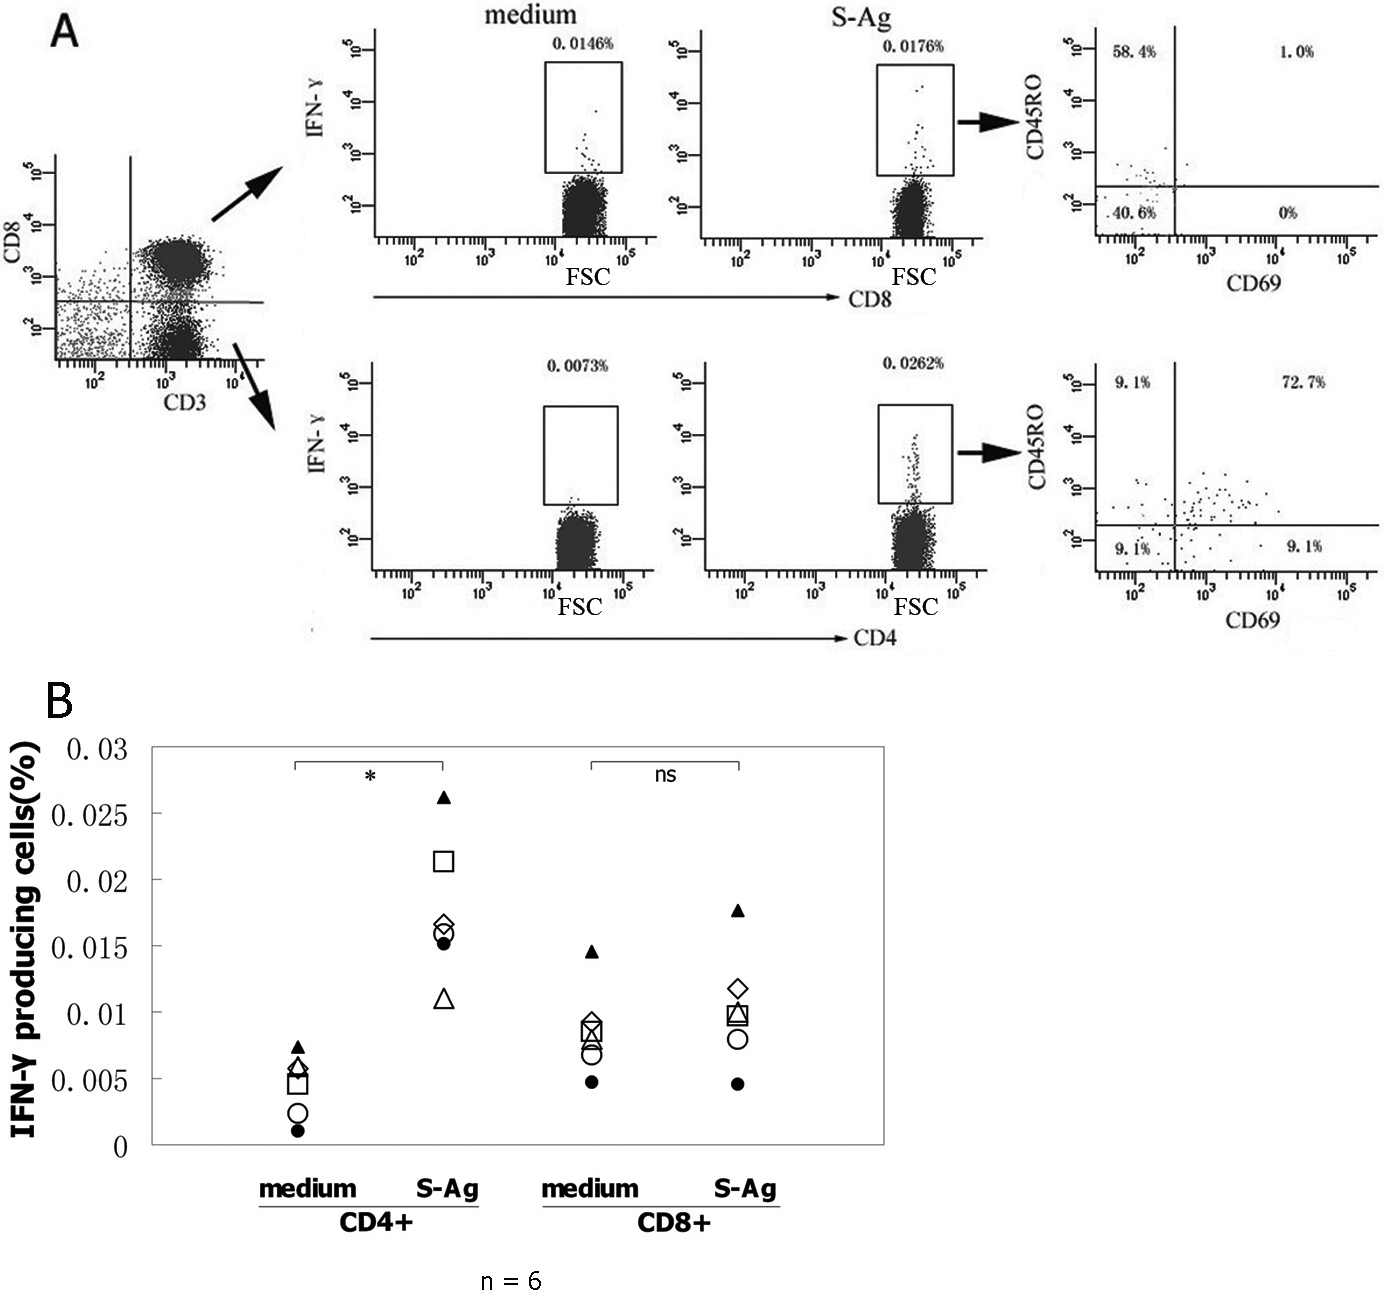
Figure 2. Phenotype of S-Ag specific T
cells detected by intracellular cytokine staining. PBMCs from the
active BD patients with a response to S-Ag were cultured with or
without mixed S-Ag peptides plus anti-CD28 mAb and then were stained
and examined by five color FCM. Lymphocytes were first gated using
Forward Scatter (FSC) combined with Side Scatter (SSC), and then the CD3+CD8-
and CD3+CD8+ cells were gated for analyzing the
expression of IFN-γ in CD4+ T cells and the expression of
IFN-γ in CD8+ T cells. Lastly, the expressions of CD69 and
CD45RO molecules on IFN-γ+CD4+ and IFN-γ+CD8+
T cells were analyzed, respectively. A: The charts show the
phenotypic feature of S-Ag specific T cells of one representative
active BD patient. B: The chart represents the expression of
IFN-γ as the percentage of total CD4+ or CD8+ T
cells in six different patients. Data were analyzed by Student’s t-test.