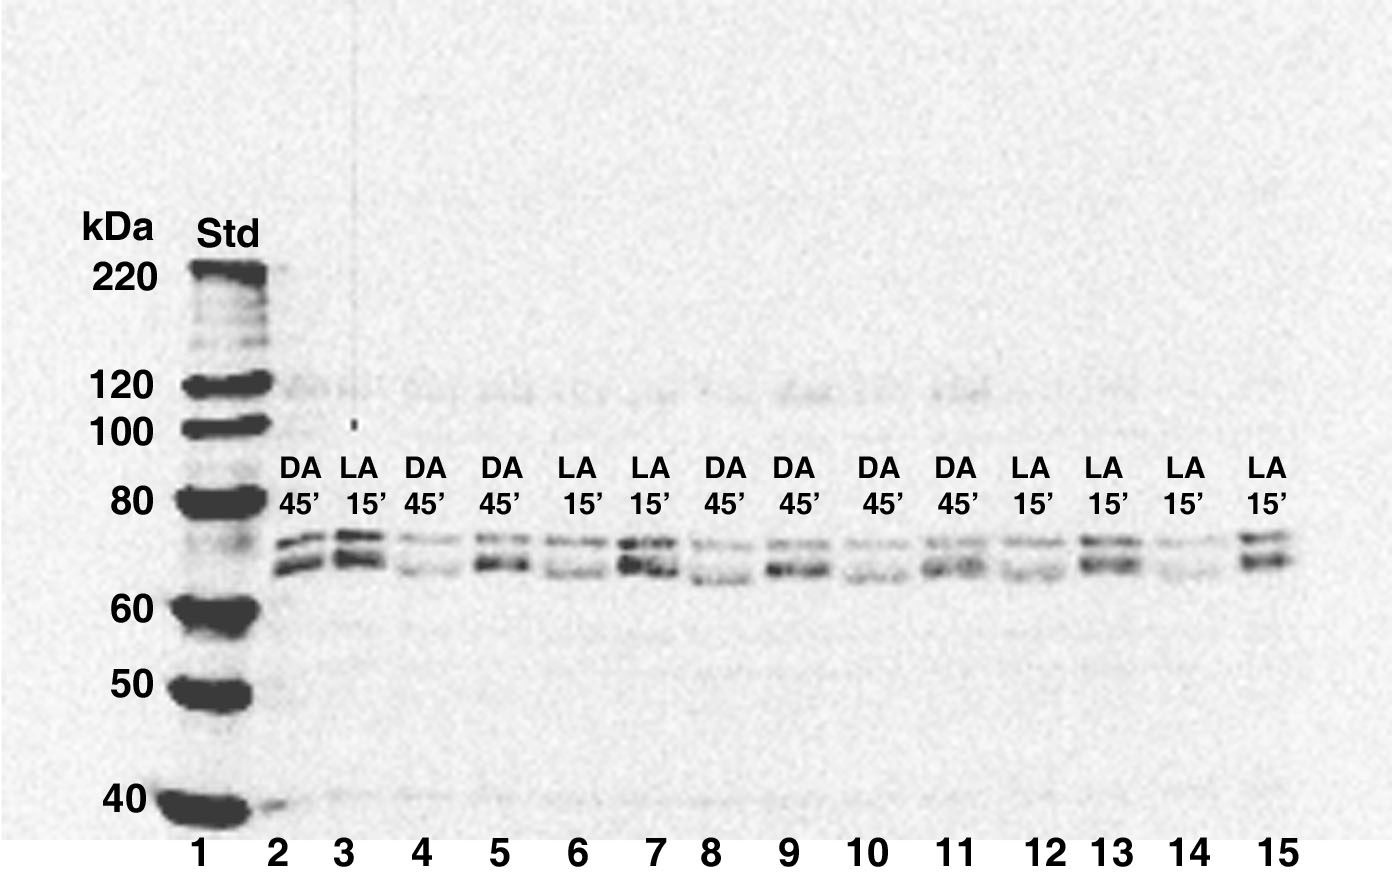
Figure 7. Western blot showing the effect
of CIP on CPEB size. Equal concentrations of total retinal protein
isolated from a single 15 min light-adapted (LA15) retinal sample and a
single 45 min dark- adapted (DA45) retinal sample were chosen at
random. Lanes 2-3: The signals of the two major immunoreactive bands
migrating between 60-80 kDa are detected in the DA45 and LA15 lacking
CIP and 100x protease inhibitors. Lanes 4-15: All samples in lanes 4-15
were treated in the presence of 100X protease inhibitors. DA45 and LA15
samples in lanes 4 and 6 were incubated in the presence of CIP (0.1 μl)
for 30 min. Lanes 5 and 7 contain DA 45 and LA15 samples incubated in
the absence of CIP for 30 min. DA45 and LA15 samples in lanes 8, 10,
12, and 14 were incubated in the present of CIP for 1 h. Samples in
lanes 8 and 12 contain 0.2 μl of CIP and samples in lanes 10 and 14
contain 0.1 μl of CIP. Lanes 9, 11, 13, and 15 contain DA 45 and LA15
samples incubated in the absence of CIP for 1 h. The molecular weight
of the smaller of the two immunoreactive bands migrating between 60-80
kDa is remarkably reduced in all samples incubated in the presence of
0.1 μl or 0.2 μl of CIP. Although not visible in this 12% blot, the
size of the 30 kDa band is not affected. The molecular weight sizes
(lane 1) correspond to the fragments of the Magic Mark XP protein
standard (Invitrogen). The following abbreviations are used in the
figure: standard (Std), light-adapted (LA), and dark-adapted (DA).