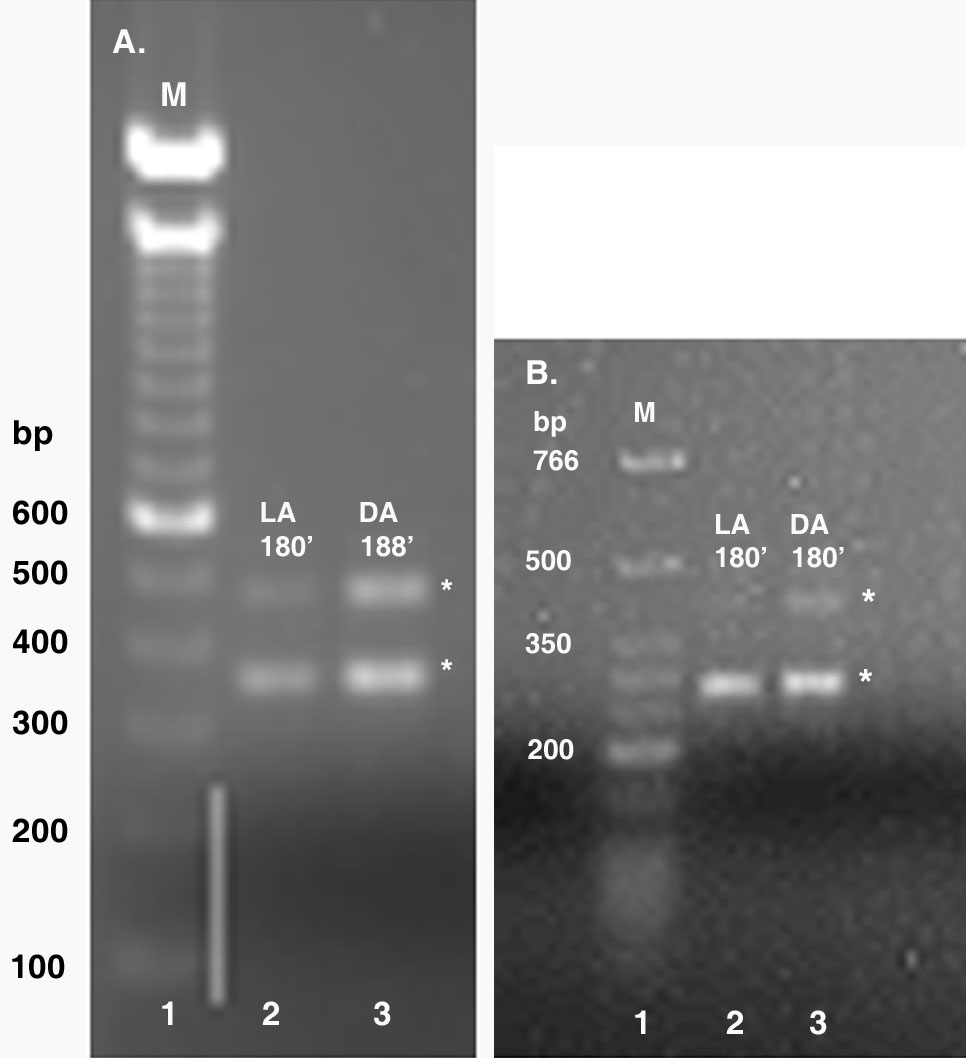
Figure 3. Agarose gel electrophoresis of
S-crystallin 3’-RACE. Equal concentrations of mRNA used for 3’-RACE was
isolated from control octopuses at 180 min of dark or light adaptation
and from octopi moved to the opposite lighting conditions at 5 min, 15
min, and 45 min time intervals. Shown in this figure is the 3’-RACE for
the 180 min intervals. The asterisks indicate the approximate size of
the amplified S-crystallin 3’-RACE fragments. A: Amplification
with S-crystallin GSPs generated two fragments at approximately 350 bp
and 500 bp in LA and DA octopus retinas (lanes 2 and 3). B:
Amplification with S-crystallin nested gene specific primers (NGSPs)
generated two fragments at approximately 300 bp and 450 bp, and
although barely visible, the 450 bp fragment is present in LA retinas
(lanes 2 and 3). The DNA marker sizes (lane 1) in A and B correspond to
the fragments of the 100 bp DNA and low molecular weight ladders
(Invitrogen and New England BioLabs, Inc.), respectively. The following
abbreviations are used in the figure: marker (M), light-adapted (LA),
and dark-adapted (DA).