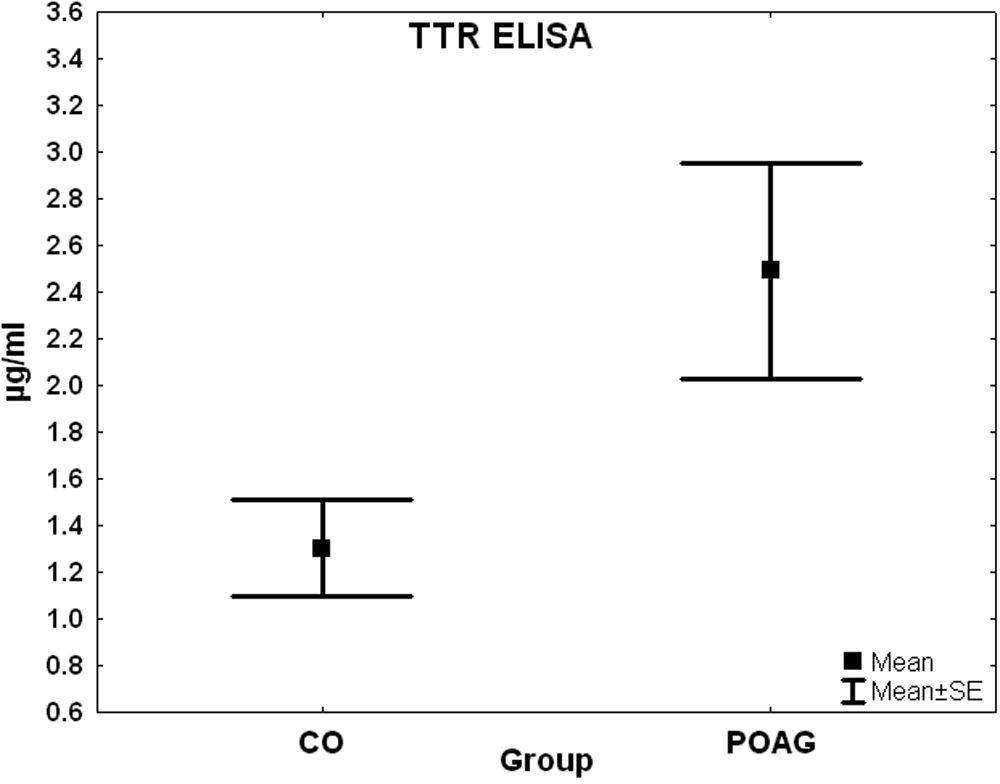
Figure 9. Box plot of transthyretin
concentration measured by ELISA. Levels of transthyretin protein
(mean±SE) were plotted for control subjects (CO) and patients with
primary open-angle glaucoma (POAG). The protein was detected using a
specific ELISA. The POAG group showed significantly higher levels of
TTR then the control group (p=0.03).